Basic idea for the formula: when the chart is bullish, best to hold XMR. When it's bearish, best to hold ZEC. Prediction: ZEC price doubles XMR in the next couple months.
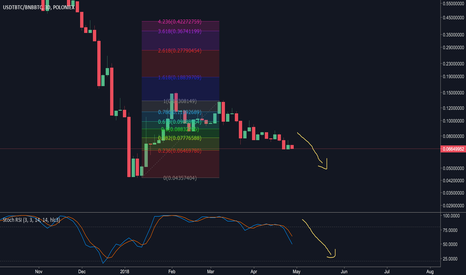
Basic idea of the chart: when it's bullish, best to hold USD or BTC. When it's bearish, best to hold SALT. Hoping for some more bearish-ness from the chart, and I'm long on SALT.
Basic idea for the formula: high volume alts vs the BTC buying power of USD. When the chart is bullish, we're in an altcoin season. When it's bearish, better to have your money in Bitcoin or USD (which one depends on BTCUSD conditions). * * * Looks like the geomean of the three coins (ADA/DASH/XEM) has sunk to a potential accumulation range, but I still think...
Looks to me like AirSwap and Bancor are in the accumulation phase -- .618 fib retracement would be around a 3x from here.
Taking a peak at the Binance Coin volume. Looks like it's been steadily falling -- while price has remained the same. On the 4-hour chart: 50 EMA of volume just crossed the 200 EMA not too long ago. Would think price follows soon.
Basic idea for the chart: when it’s bullish, best to hold Binance Coin. When it’s bearish, best to hold Monero. After a retrace to the .618 fib level, Stoch RSI is reset and target is now the 1.618 level (or Binance Coin to be worth 1/10 of XMR).
Basic idea for the formula: when it's bullish, best to hold USD or Bitcoin. When it's bearish, best to hold the altcoin (in this case: Binance Coin). The chart looks fairly bearish, Stoch RSI is plummeting, and really the only fibonacci level in the way: all-time highs. Should be good news for BNB holders.
On the 3-Day chart: looks like a hanging man candle to me. Would be a good sign for ZEC holders.
Charting ETH’s volume (not price): the 50 EMA is still below the 200 EMA on the daily chart.
Basic idea for the formula: USD buying power of Bitcoin vs altcoin (in this case, Nano). When the chart is bullish, best to hold USD or BTC. When it's bearish, best to hold Nano. USDTBTC/NANO just hit 1.618 fib level. Would bet there is some resistance here, and the formula heads back down to the 1.0 mark (or, in other words, good news for Nano holders).
Huge wick, candle close above $8655. See you guys around $9100.
Basic idea of the formula: USD/Tether buying power of Bitcoin vs Bread. When the chart looks bullish: best to have your money in USD or Bitcoin. When the chart looks bearish: best to own Bread (BRDBTC). MACD and chart pattern would indicate to me: think we're going to see an uptick in the value of Bread.
Basic idea for the formula: when the chart is bullish, best to hold USD or BTC. When it's bearish, best to hold ZRX. Both EMAs and Ichimoku cloud look prime for an incoming ZRX pump. Stoch RSI headed in the right direction, too.
Potential H&S forming on USD buying power of BTC vs BLZBTC value. Basic idea: when the chart’s bullish, better to hold USD or BTC. When it’s bearish: alts are the best vehicle of accumulating BTC (in this case, Bluzelle).
Not a long-term short, but think we'll see a drop. Looks like a small H&S is forming on the hourly chart.
Higher price, lower oscillator. Will keep an eye on the 13/49 EMA cross. Overall, it could be forming a huge H&S (where we're in the middle of the head formation). Isn't something I'd feel comfortable holding right now.
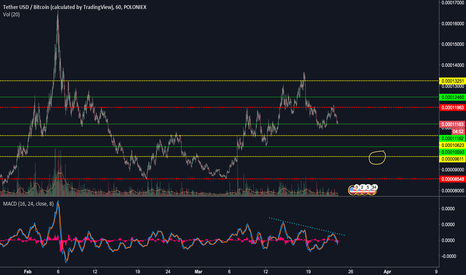
Trying my hand at charting levels for Tether. I'm of the mind that BTC sees a high of $9.8k again -- but who knows. Could go all the way down to touch the major red level. Would be pretty bullish on BTC in that case. (Third time's the charm, right?)


