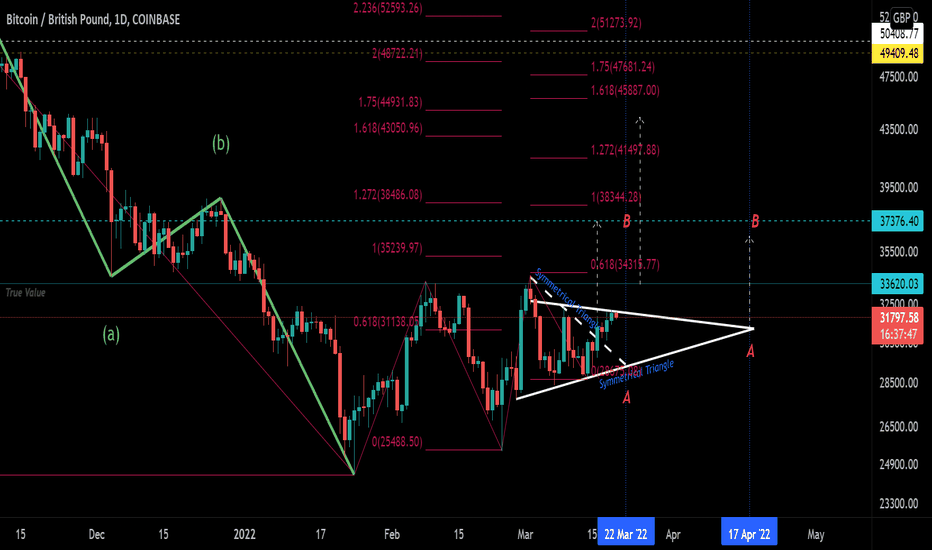
Well if B is in for this local bottom then targets as per chart are possible? thepatternsite.com
Are we about to enter the bear market ~ yes probably but in the context of a Bull correction! We have taken the ABCDE triangle out with breaking leg C level.
With bitcoin closely correlated to NASDQ & US10YR Treasury markets ~ is it time to break the mould? For it to happen this falling wedge needs increase in volume and perform like the "Dip" example below:- thepatternsite.com
If we have completed the "Triple Combo Wave(WXYXZ)" the Z five leg down then we might be entering Intermediate Wave (3)?
This next leg E, is proving troublesome and it could be that we have not completed D yet in the ABCDE Elliott Wave Triangle?
It has been a clear breakout of this Original Pitchfork and I believe we are looking for E lower degree b in the (3,3,3,3,3) in the Macro ABCDE Elliott Wave Triangle? school.stockcharts.com
Interesting that we have stopped at the lower extended diagonal of the previous "Bull Pennant" & possible end of sub-wave b ~ so lets see now if we continue to make the D leg of the sub-wave c?
I can get 5 sub-waves out of what looks like a "Leading Diagonal" see link below:- thepatternsite.com
Can this still happen ~ yes it can with this Macro ABCDE Elliott Wave triangle!? Conclusion more sideways action in a large range for a few months yet....unless of some significant event! school.stockcharts.com
Looks as if this harmonic is correct we may drop a bit further see link for possible targets! The potential bull flag looks a busted pattern. It this is a 1/2 wave in a higher degree we need to stay above recent lows i.e. $34300 1.bp.blogspot.com
I think this wave (iv) has been complex and if we stop at the 0.382 Fibonacci level then falls in line with Elliot wave thinking. My labelling maybe a bit off but it gives the general idea?
Well now ~ will the Bulls succumb to the Bears or does this "Bull Flag" and zig zag correction confirm the bear run is over its over?
This fib channel looks as price is respecting its levels , so lets see if we are going to test $50K in a lower degree wave 3?
We have n't yet quite made the absolute target for this flag but I am hopeful! thepatternsite.com
I think my last chart was a little modest as to the target, so I have revised it to test all time highs again!
I got a couple of targets as per chart if this plays out and kind of falls in line with the bullish Fibonacci levels?
The next few hours will be crucial to see if we can break the upper diagonal of the "Symmetrical Triangle" in my opinion? thepatternsite.com
With Symmetrical Triangles they can break either way but I favour to the upside using the "The Triangle Apex" theory as a change in trend! thepatternsite.com


