Market analysis from FOREX.com
Over the past four trading sessions, gold has depreciated more than 3.5%, showing a renewed and steady bearish bias around this major safe-haven asset in the short term. Selling pressure has remained strong recently, as confidence in financial markets has gradually improved. Investors have responded positively to the latest trade agreement developments, which have...
The Japan 225 contract has spent the past three sessions partially unwinding the sharp rally sparked by Japan’s trade agreement with the United States last week, leaving price resting on a known support level. Near-term price action may determine whether bullish or bearish setups hold the upper hand. If price holds 40162, longs could be established above with a...
Perhaps it's a buy the rumor sell the news event, or maybe it's just squaring up ahead of a really big week of U.S. drivers, but so far this week EUR/USD is putting in a sizable sell-off. Notably, the rally last week ran through the ECB rate decision and price held at a lower-high as bulls suddenly got shy around tests of resistance. This retains bearish...
Reversals of long-term moves can be tough to work with, especially for shorter-term traders. While fundamentals are important for shaping future price moves and technicals are key for explaining past moves, while also allowing for strategy and risk management, it's sentiment and positioning that probably matter more. Because if any and everyone in the world...
It's a big week for both the U.S. Dollar and the Japanese Yen. Last week started with a sell-off in USD/JPY following results of elections that came in over the weekend. I looked at support structure in the pair shortly after, and the 145.92 level came into play to hold the lows in early-Thursday trade and since then bulls have been going to work. The pair is...
A good illustration of FX market structure is on display today. EUR/USD is down sizably after teh announcement of the EU trade deal and this may be a 'buy the rumor, sell the news' kind of event. But, there's also the possibility that this is squaring up ahead of a really big week of drivers with FOMC, Core PCE and NFP all scheduled for later this week. But,...
AUD/USD has broken down from a rising wedge formation after rejecting near the 61.8% Fibonacci retracement at 0.6558. This pattern, typically bearish, suggests the recent uptrend is losing steam — a view reinforced by Friday’s strong bearish candle closing below both the wedge support and the 50-day SMA (0.6510). The price action now sits just above the 200-day...
Bitcoin is consolidating within a bullish pennant pattern just below the 120,000 level, following a sharp rally from the June lows. Price action has compressed between converging trendlines, forming higher lows and lower highs — a classic continuation formation in an uptrend. Importantly, BTC remains well above prior resistance (now support) at 112,000, with both...
EUR/USD has snapped a key confluence zone after rejecting the 78.6% Fibonacci retracement level near 1.1745. The latest daily candle shows a sharp bearish engulfing bar that sliced below both the ascending trendline and the 50-day SMA (1.1565), signaling a potential trend reversal or deeper correction. This breakdown follows a multi-week uptrend, and momentum...
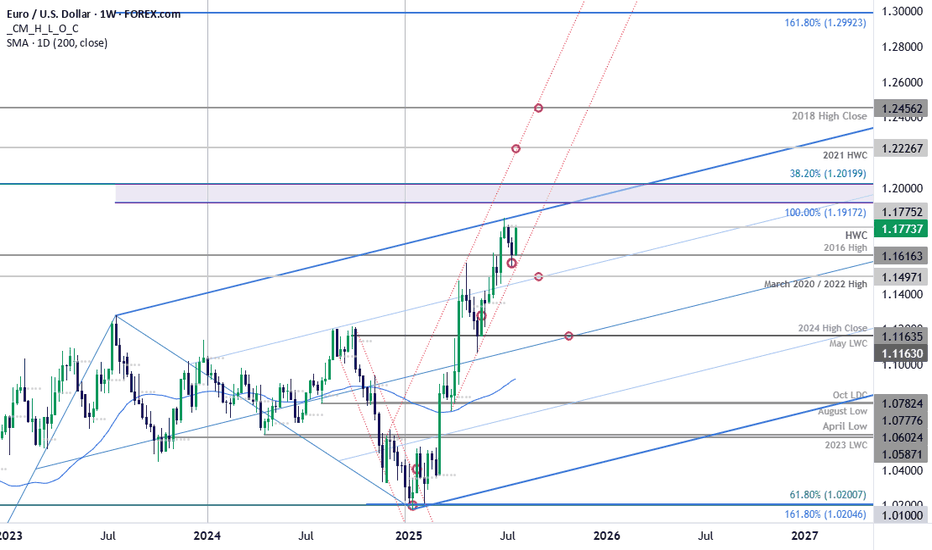
Euro defended resistance at the monthly opening-range high / July open at 1.1787-1.1805 last week with price plunging back into support today at the late-February trendline / 2016 high at 1.1616. Medium-term bullish invalidation rests with the April high at 1.1573 and a close below this level would suggest a more significant high is in place / a larger...
There are multiple factors weighing on the EUR/USD today. We have seen a broad dollar rally, suggesting that the trade agreements are seen as net positive for the US economy, even it means rising inflation risks. With higher tariffs and Trump’s inflationary fiscal agenda, interest rates in the US are likely to remain elevated for longer. As far as the euro itself...
Silver’s latest pullback has seen it move back towards long-running uptrend support, creating a decent entry level for longs with price momentum favouring buying dips over selling rips. Longs could be established above the trendline with a stop beneath for protection, targeting minor resistance at $38.73 initially and, if broken, the July 23 swing high of $39.53....
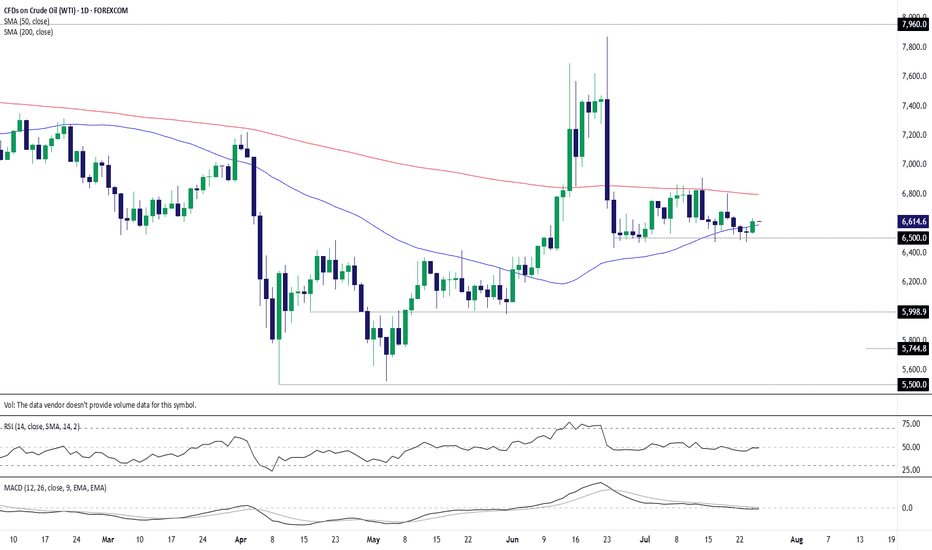
After nine failures to break and close beneath $65 per barrel over the past month, you have to wonder how much longer bears will persist in attempting to take out the level. Following a nice pop higher on Thursday, completing a morning star pattern and closing above the 50-day moving average, it may be time for WTI bulls to have their day in the sun. For those...
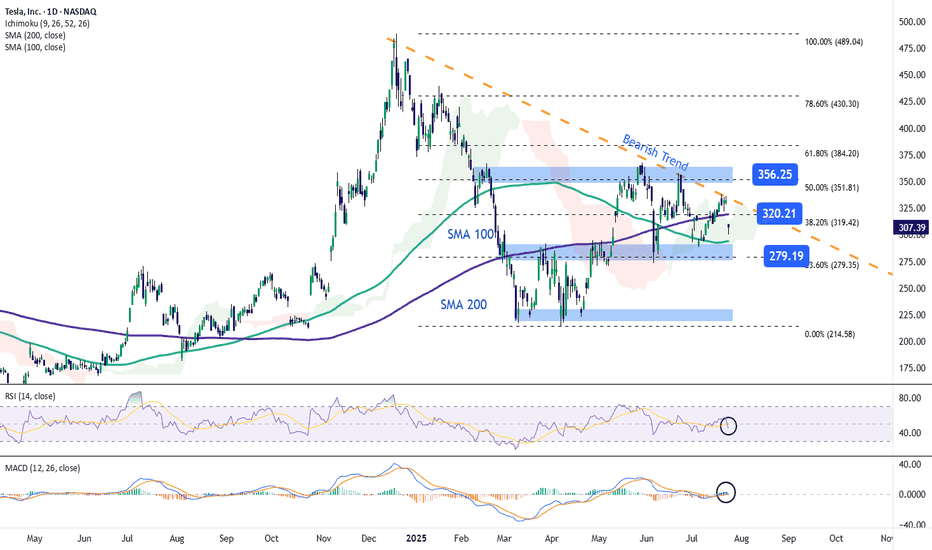
Shortly after reporting earnings, Tesla stock fell more than 9% in the final hours of trading. This new bearish move is mainly due to the company’s earnings per share (EPS) of $0.40, which missed expectations of $0.43, and revenue of $22.5 billion, below the projected $22.74 billion. These figures indicate that Tesla failed to meet market expectations, triggering...
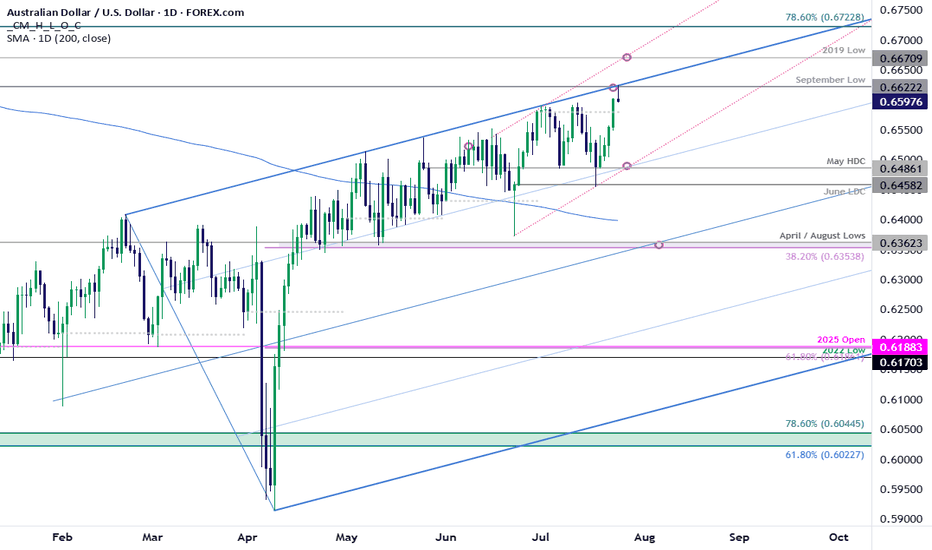
The Australian Dollar surged more than 1.8% this week with AUD/USD now testing multi-month uptrend resistance at fresh yearly highs. A four-day rally takes price into confluent resistance at the September low / upper parallel at 6622- The focus is on today’s close with the immediate advance vulnerable while below this key slope. Subsequent resistance objectives...
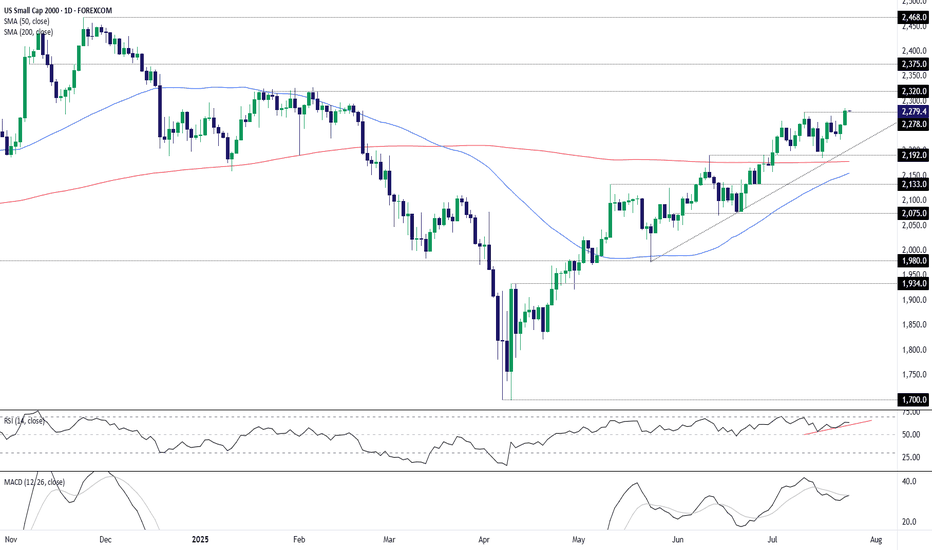
Sitting in an obvious uptrend with momentum indicators skewing increasingly bullish, it looks like the U.S. small cap 2000 contract wants to go higher. The dash for trash is on! Having just cleared the July 10 high of 2278, it’s provided a decent setup to initiate fresh longs, allowing for a stop beneath that level for protection against a reversal. 2320 screens...
Euro is poised to snap a two-week losing streak with EUR/USD up more than 1.2% since the Sunday open. The advance takes price back into weekly resistance ahead of tomorrow’s European Central Bank rate decision and the focus now shifts to the weekly close for guidance. Euro plunged more than 2.3% off the June high with price briefly registering an intraweek low...
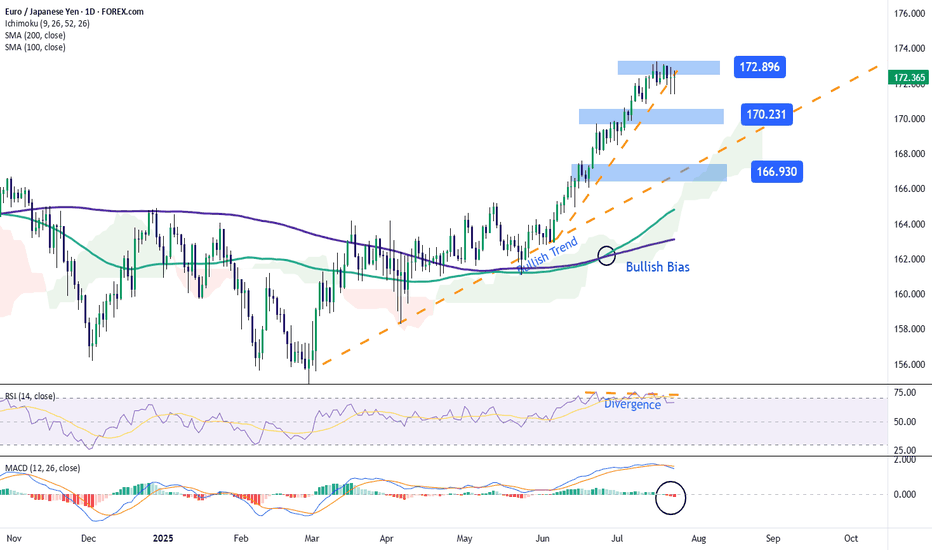
Over the past three trading sessions, the EUR/JPY pair has declined by up to 0.8%, as the yen has steadily gained strength, preventing the euro from maintaining its momentum in the short term. Selling pressure has held firm, especially after news that Japan finalized a new trade agreement with the United States, which lowered the initially proposed 25% tariff to...


