Market analysis from FOREX.com
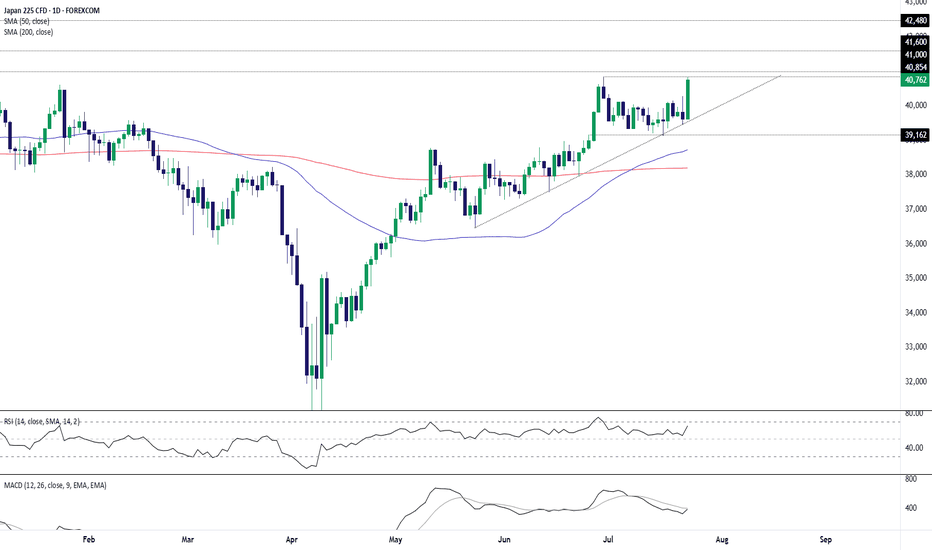
The Japan 225 contract is ripping higher today on a trade deal being reached between the U.S. and Japan, including the apparent lowering of auto tariffs to 15%. The price has already bounced strongly from uptrend support established in May, putting a potential retest of the June 30 high of 40854 on the cards. With momentum indicators perking up—pointing to...
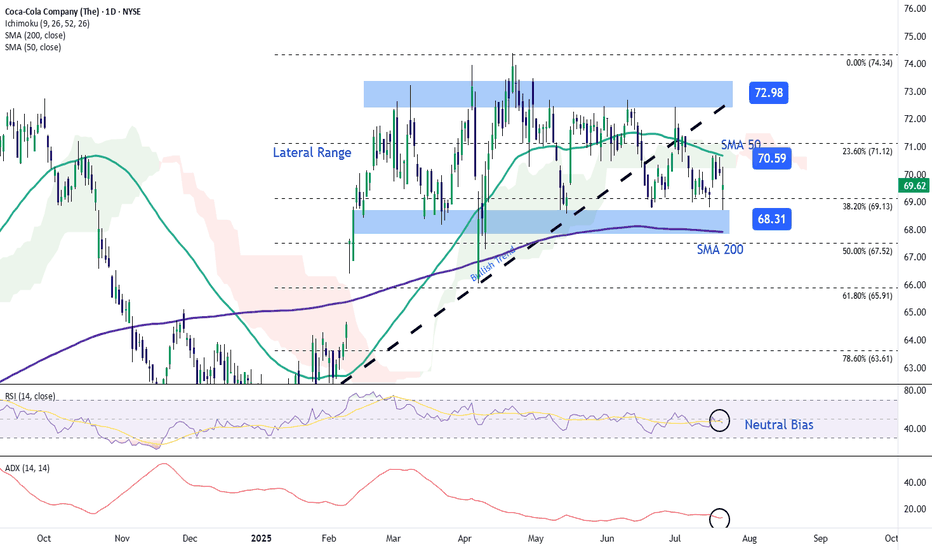
During the latest trading session, Coca-Cola stock maintained a clear neutral bias after a nearly 1% decline, falling below the $70 per share level. This movement came despite the company reporting better-than-expected results, with earnings per share (EPS) of $0.87, above the $0.83 expected, and total revenue of $12.62 billion, exceeding market estimates of...
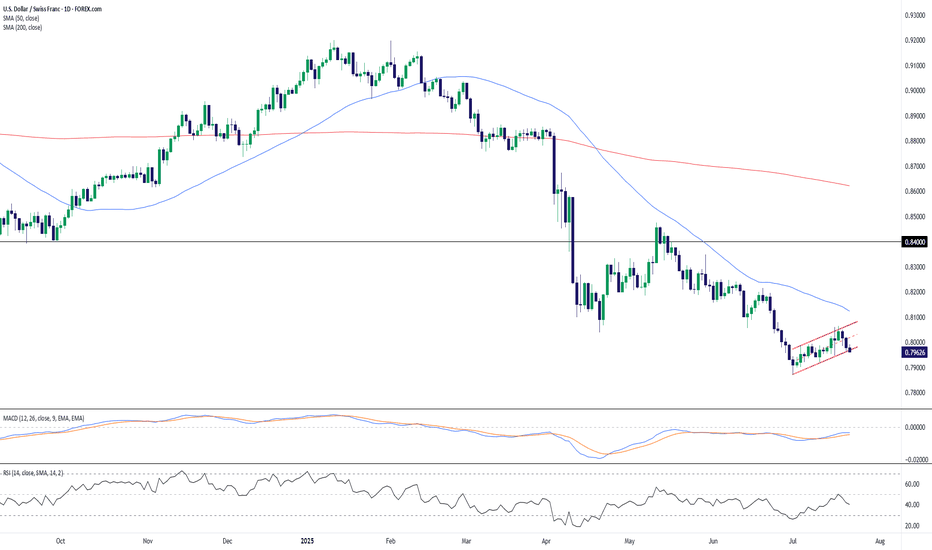
USD/CHF remains under pressure after a sustained downtrend and is currently consolidating within a potential bearish flag pattern. Price action has carved out a rising channel after the sharp June selloff, but the structure appears corrective rather than impulsive—suggesting the dominant bearish trend may soon resume. The pair is struggling to hold the...
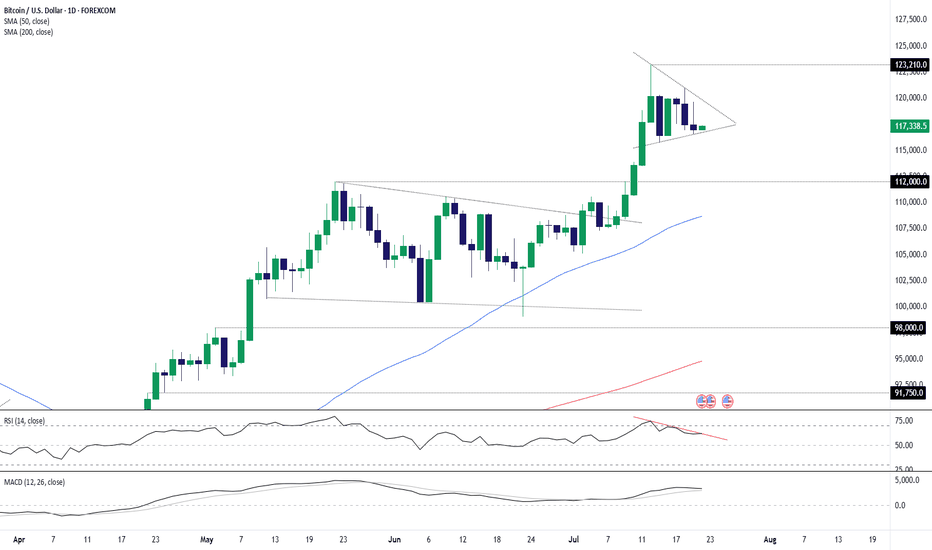
Bitcoin remains in a strong uptrend, consolidating just below the $120,000 level after a powerful breakout from the $112K zone earlier this month. Price action has formed a classic bullish pennant pattern on the daily chart, characterized by converging trendlines and declining volume—a textbook setup for trend continuation. The uptrend remains technically intact,...
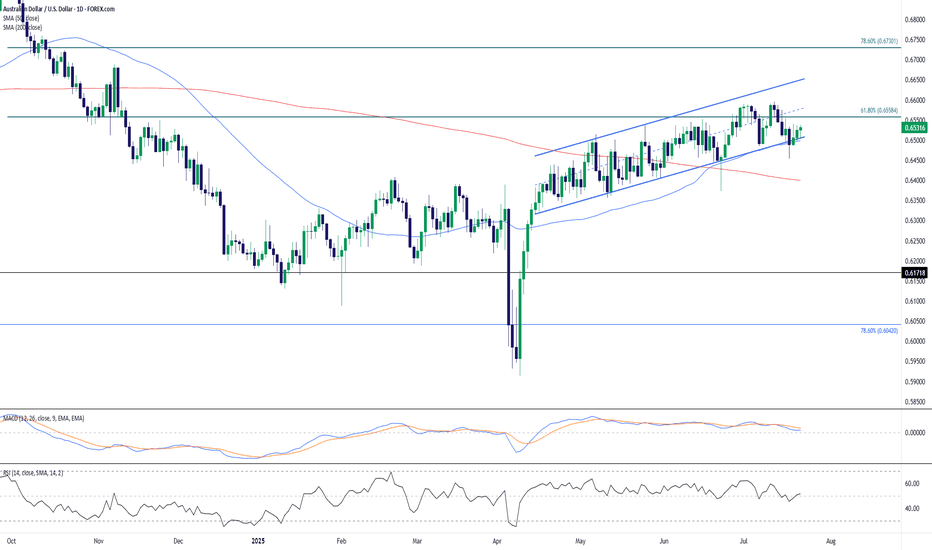
AUD/USD is currently holding just above the 0.6500 psychological level after retreating from the 0.6558 Fibonacci resistance (61.8% retracement of the October–April decline). Price action has recently broken beneath the lower boundary of a rising wedge pattern—a traditionally bearish signal—raising the risk of deeper downside ahead. The 50-day SMA (0.6498) and...
Bitcoin is coiling within what resembles a bull pennant pattern, hinting at another bout of consolidation before the rally resumes. Trading near the lower end of the recent range, Monday’s pullback offers an appealing entry point, allowing longs to be established around current levels with a stop beneath the July 15 low for protection. The downtrend from the...
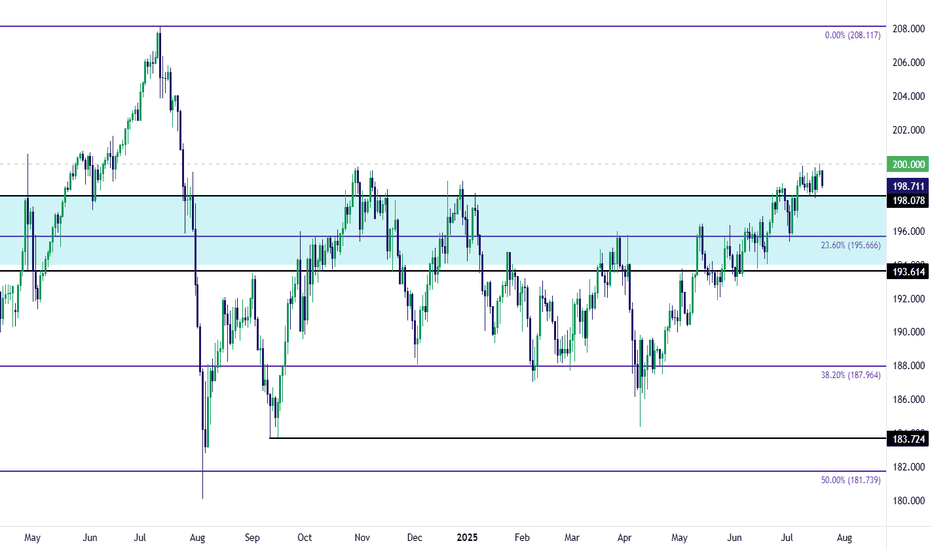
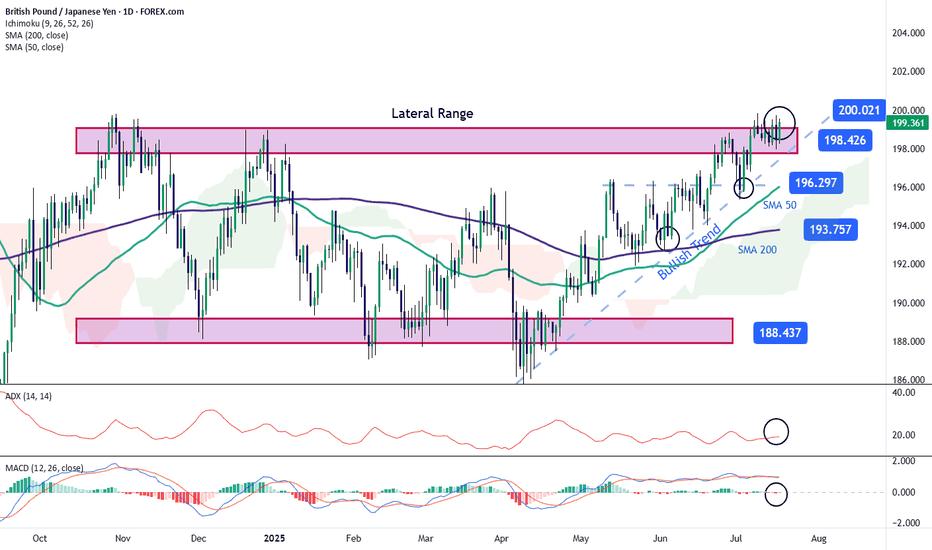
I've written before of the August/September 2008 gap in GBP/JPY and here 17 years later, it continues to show items of interest for intra-day trading strategy. Most recently, it was the top of that gap at 198.08 holding support on both Monday and Wednesday of last week - allowing for a flare up to just 2.5 pips away from the 200 psychological level. Bulls have...
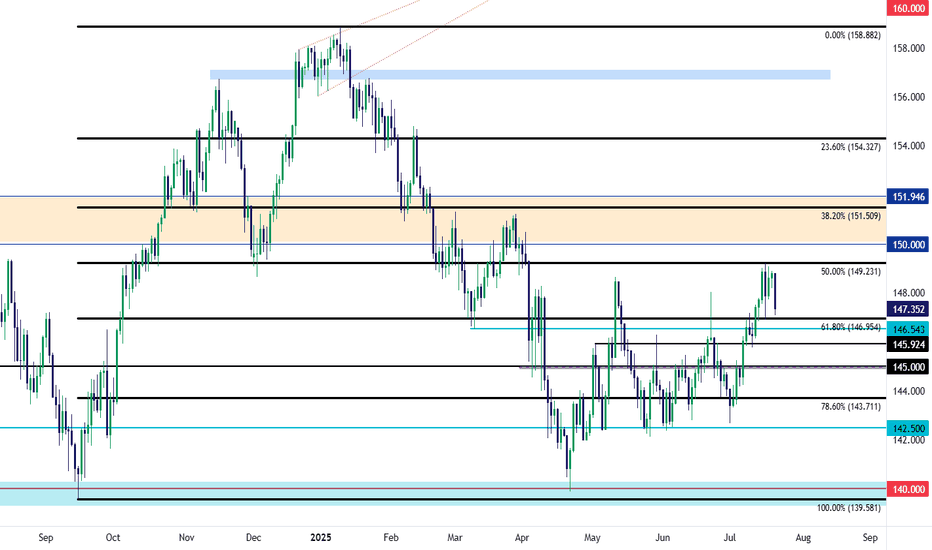
USD/JPY continues to brew traps on both sides of the pair as last week's push up to fresh three-month highs has been followed by a decisive snap back in the pair. The drive behind the move is also of interest, as Japanese election results over the weekend haven't been completely digested by Japanese markets, as they were closed on Monday for a public holiday. So...
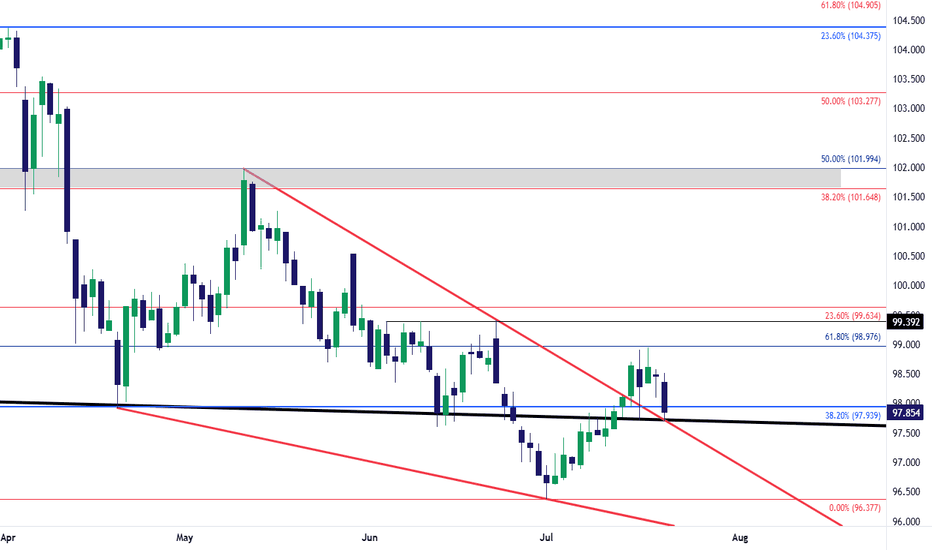
The trendline that originated in 2001 and connected to the 2020 high came in to hold the lows in July of 2023, and then again on Easter Monday. That level also held as support in June albeit temporarily, as bears grinded a sell-off into the Q2 close. In early-Q3 trade, that trendline was resistance on a few different occasions, until buyers could eventually take...
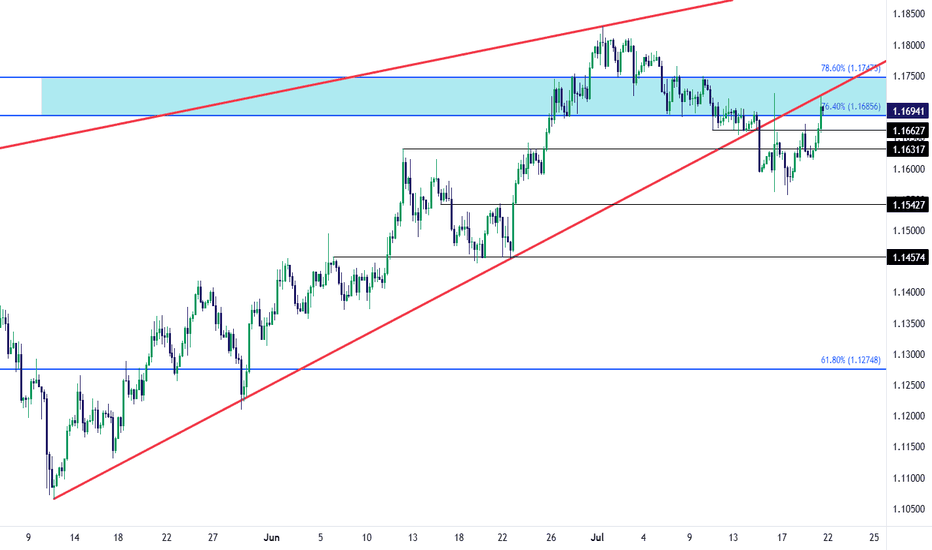
EUR/USD bears had an open door to make a run last week and, so far, they've failed. The Wednesday turn around Trump's threat to fire Jerome Powell certainly made a mark, but the question now is whether the USD can respond to support at a longer-term trendline; and, in turn, EUR/USD is now testing in the zone between 76.4 and 78.6% Fibonacci retracements of the...
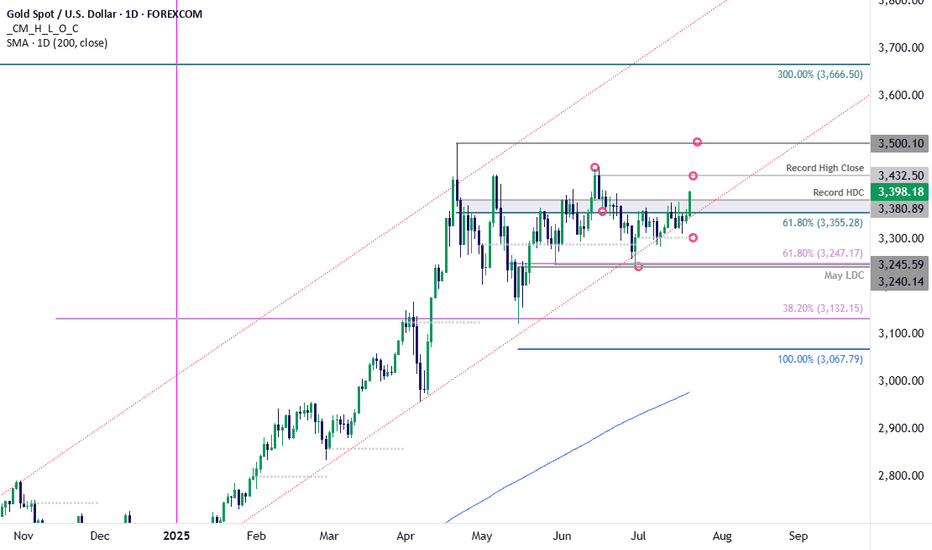
Gold is attempting to breach resistance today at the 61.8% retracement of the April decline / record high-day close (HDC) at 3355/80- watch the close. The advance marks a breakout of the July opening-range and a topside breach here exposes the record high-close at 3432 and the record highs at 3500. Initial support now back at 3355 with bullish invalidation...
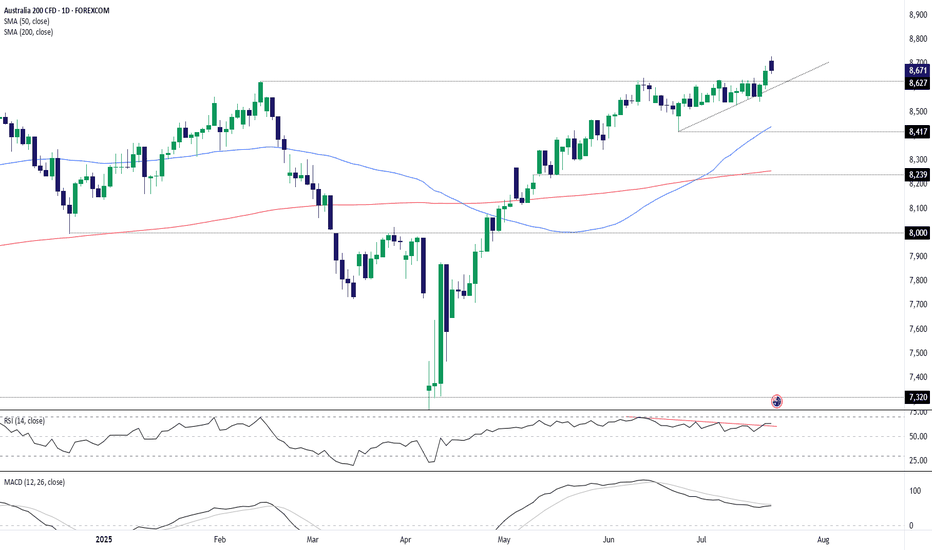
The Australia 200 contract continues to trade above former horizontal resistance at 8627, with Monday’s pullback offering an improved entry level for longs looking to buy the breakout. Bullish positions could be established ahead of 8627, with a stop beneath for protection. The session high of 8727 looms as an initial test for longs, with a push above that level...
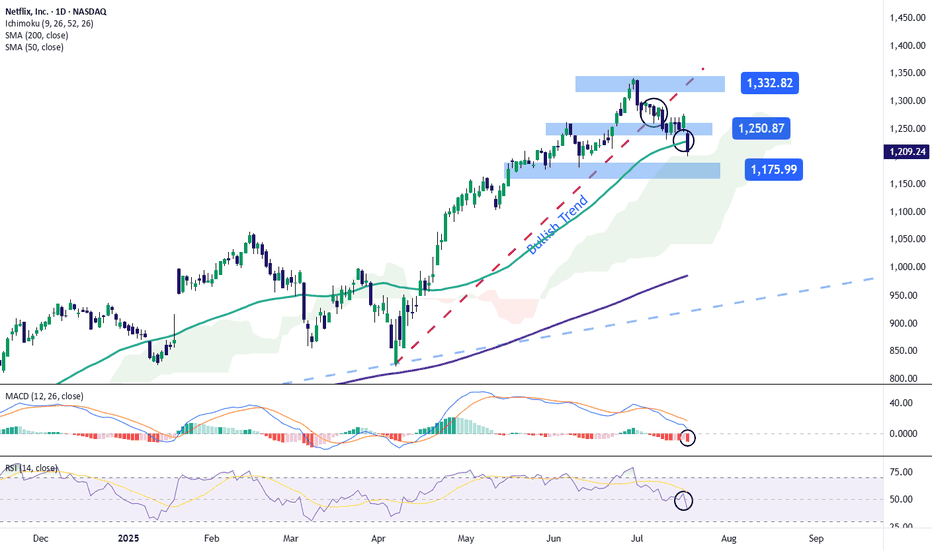
Shortly after publishing its financial results, Netflix posted a decline of over 5% toward the end of the week and continues to show a strong bearish bias. This comes despite reporting a positive earnings per share (EPS) figure of $7.19, beating the expected $7.08, and revenue of $11.08 billion, slightly above the forecast of $11.07 billion. However, in its...
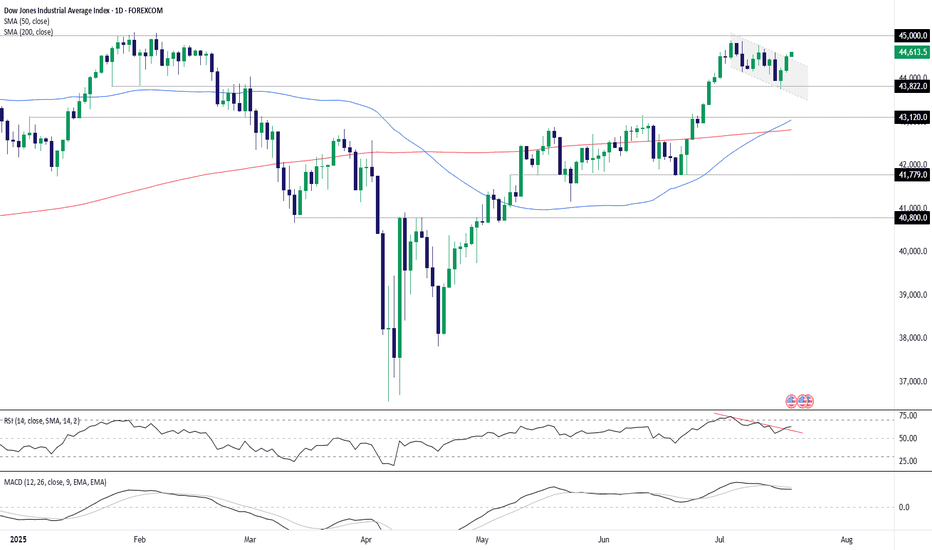
The U.S. 30 contract has broken topside from a short-term bull flag, reinforcing the broader uptrend and putting 45000 resistance back in focus. Traders looking to play a continuation can consider longs with a tight stop beneath for protection. A break of 45000 may trigger a fresh burst of upside momentum, putting big figures above in play. Bullish price...
The GBP/JPY pair has gained over 0.5% today in favor of the British pound, as the Japanese yen continues to weaken steadily. The recent escalation in the trade war, where potential 25% tariffs may begin to affect Japan in the short term, has contributed to the yen’s steady decline. For now, this remains one of the main catalysts behind the price movement, which is...
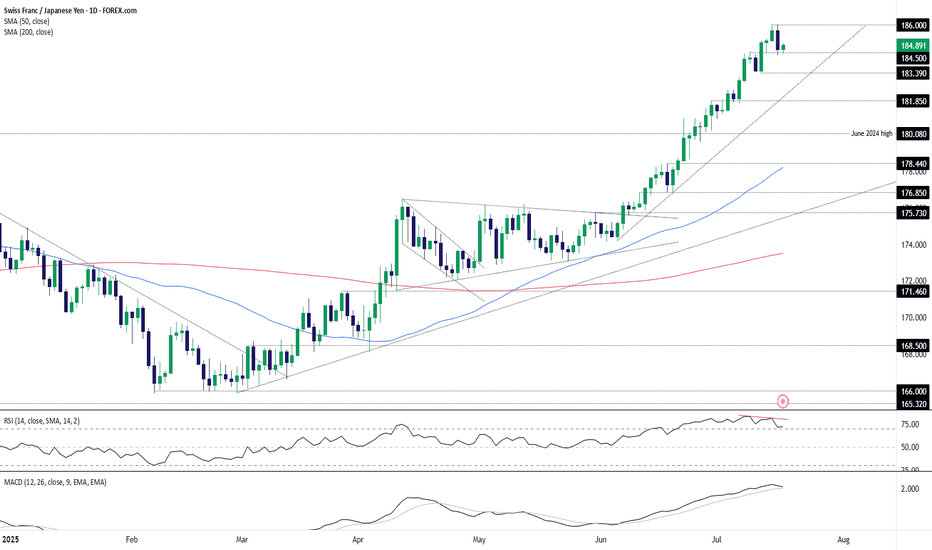
Is the high-flying CHF/JPY cross about to hit an air pocket? Having printed a bearish engulfing candle on Wednesday, and with bearish divergence between RSI (14) and price while still in overbought territory, the risk of a pullback appears to be growing. MACD is also curling over towards the signal line, hinting that bullish momentum is waning. Should the price...
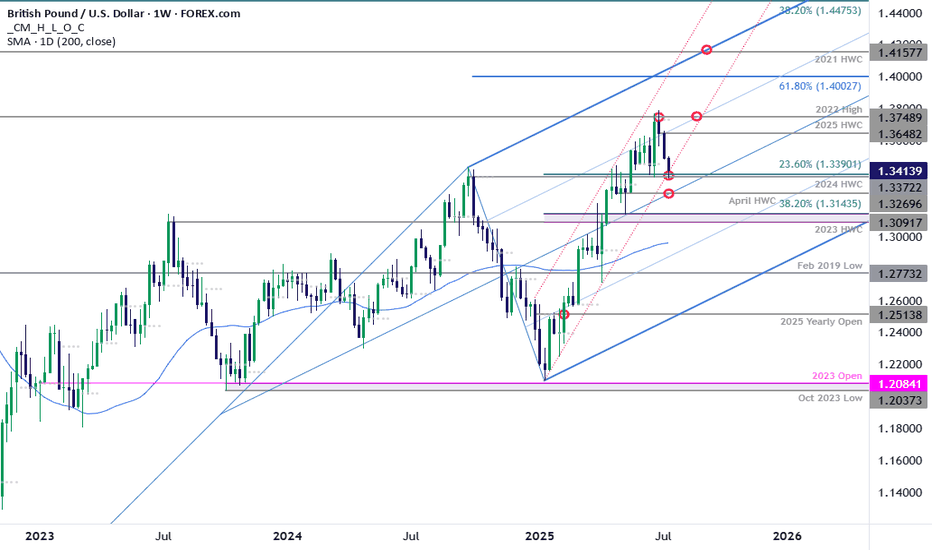
Sterling is poised to mark a third consecutive weekly decline after turning from resistance at multi-year highs. The decline takes price into critical support at the yearly trendline- this is a make-or-break level for the bulls. GBP/USD is testing confluent support today at 1.3372/90- a region defined by the 2024 high-week close (HWC) and the 23.6% retracement of...
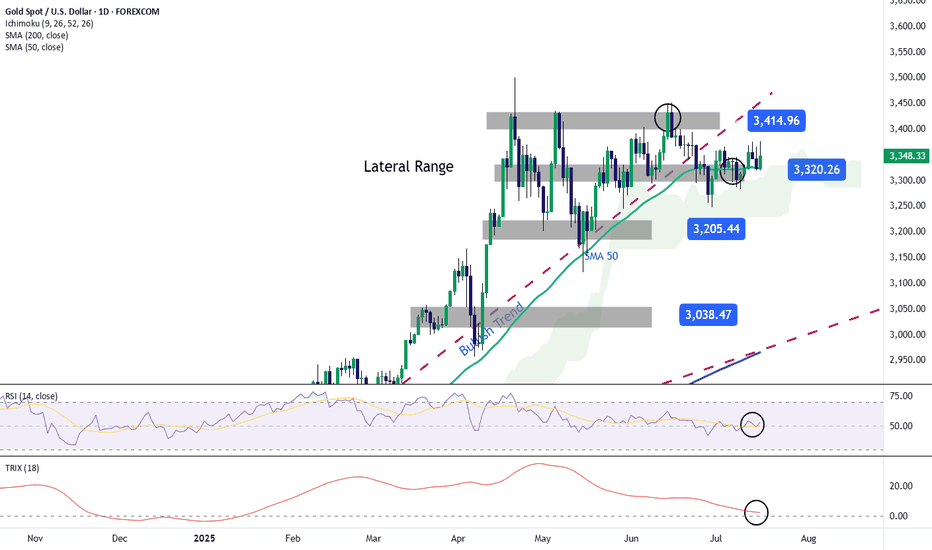
Today's session marked a new upward move for gold, with gains of more than 1%, pushing prices above the key $3,300 per ounce level. For now, the bullish bias has remained firm shortly after reports suggested that the U.S. government may be preparing to move away from the current Federal Reserve Chair, Jerome Powell, mainly due to the Fed’s failure to deliver on...
