Market analysis from WhiteBIT
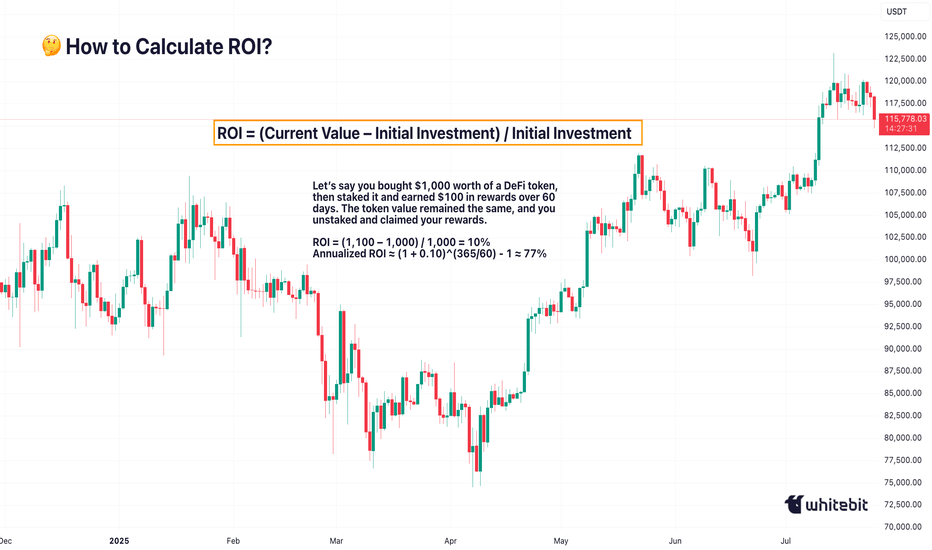
Hello, Traders! 👏 Return on Investment (ROI) is often the first metric new investors focus on when evaluating an asset, a strategy, or even their trading performance. It’s easy to see why. It's simple, intuitive, and widely used across both traditional finance and the cryptocurrency sector. One formula, and suddenly you have a "score" for your investment. Green...
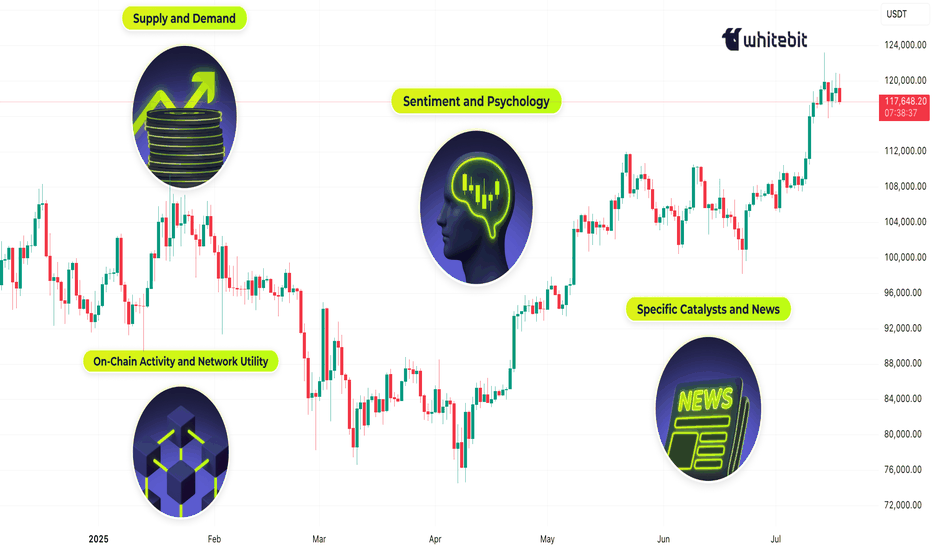
Hello, Traders! If you’ve spent any time staring at crypto charts, you’ve probably asked: “Why is this happening?” And the truth is… there’s never one simple answer. Crypto markets are complex, global, 24/7 systems. The forces behind a price move can be technical, fundamental, psychological or all at once. So let’s unpack what really moves this market. 1....
Hello, Traders! 🖖🏻 There’s probably no phrase that triggers more mixed emotions in crypto trading than: “Looks like we’re breaking out!”. Because let’s be honest…For every clean breakout that follows through with momentum… …there’s a fakeout waiting to trap overconfident entries. So, how do you tell the difference? Let’s break it down! 🧱 What Is a Breakout?...
Hello, traders! 👋🏻 Why can the same chart tell a different story on 1D, 4H, or 15M? You’ve probably been there. BTC looks bullish on the daily… bearish on the 4-hour… and totally sideways on the 15-minute. So, which one is right? The truth is: none of them is wrong. They’re just telling different parts of the story. Understanding timeframes in trading isn’t just...
Hello, Traders! 🤓 Everyone watches the chart. But not everyone watches the market itself. If you’ve ever wondered why the price suddenly jumps or stalls just below resistance, you’re likely looking at the surface, not the structure underneath. And that’s precisely what DOM in trading helps to reveal. What Is DOM Trading? Let’s start with the basics. DOM...
Hello, Traders! 😎 It’s one of crypto's most overlooked yet commonly recurring structures: the trendline break and retest. You’ve probably seen it without even realizing it. A clean trendline gets broken, price pulls away, and then, quietly, almost politely, comes back to “kiss” the line before taking off again. Or dropping. That’s the retest. And in the chaotic...
Hello, traders! 👀 Do you know why $10K matters more than $10,137.42? You’ve probably noticed it — even if you’re not watching the chart all day. Whenever Bitcoin approaches $10,000, $20,000, or $100,000, something shifts. Volatility spikes. X (formerly known as Twitter) goes wild. And traders tighten their stops. That’s not a coincidence. It’s the psychology of...
Hello, traders! 🤝🏻 It’s hard to scroll through a crypto newsfeed without spotting a headline screaming about a “Golden Cross” forming on Bitcoin or warning of an ominous “Death Cross” approaching. But what do these classic MA signals can really mean? Are they as prophetic as they sound, or is there more nuance to the story? Let’s break it down. 📈 The Basics:...
Hello, Traders! An anatomy of market psychology on the BTC chart… Sometimes it’s not about what’s next, but what we've already lived through. And this stretch on the Bitcoin (BTC) weekly chart (2021–2022) deserves a second look. What first appears to be a textbook Double Top might, with the right lens, reveal something more… mythical. Let’s break it down 👇 🔍 ...
Hello, Traders! 👋🏻 The estimated value of cryptocurrencies is a multifaceted process influenced by various dynamic factors. Unlike traditional assets, crypto prices are determined through a combination of market mechanisms, technological attributes, and investor behaviors. This article delves into the core elements that shape cryptocurrency prices, offering a...
Hello, traders! 💫 Fibonacci numbers have traveled far from ancient Italian math to modern trading charts. In technical analysis, Fibonacci Extensions aren’t just mystical ratios; they’re a structured way to project potential price targets based on crowd psychology and trend continuation. But what are they really, and why do so many traders draw those lines with...
Hello, traders! 🔥 The MACD (Moving Average Convergence Divergence) indicator is one of the most trusted tools in technical analysis — but often one of the most oversimplified. While many traders focus on signal line crossovers, the real power of MACD lies in its ability to visualize market momentum, subtle shifts in trend strength, and early signs of potential...
Hello, traders! 🦾 This cheat sheet provides a comprehensive overview of the most widely used technical analysis indicators. It is designed to support traders in analyzing trends, momentum, volatility, and volume. Below, you’ll find a handy screenshot of this Cheat Sheet that you can save and peek at whenever you need a quick, friendly refresher on your trading...
Hello, traders! ✍🏻 Understanding a chart isn't about predicting the future — it’s about recognizing what’s already happening. Whether you're evaluating a Bitcoin breakout or watching a new altcoin pump, technical chart analysis is one of the most powerful tools traders use to make sense of price movements. But how exactly do you read a technical analysis chart?...
Hello, traders! 👋🏻 If price action had a way of saying, “HOLD MY BEER, I’M NOT DONE YET,”— it would be through a flag pattern. This classic continuation setup is where strong trends take a breather before launching their next move. Whether you're seeing a bullish flag chart pattern or a bearish flag pattern, you’re looking at a market that’s just catching its...
Hello, traders! Let’s face it — price charts can feel overwhelming at first. Red. Green. Wicks. Shadows. Bodies. It’s like abstract art for traders. But once you understand candlestick pattern trading, you’ll start to see structure in the chaos—and maybe even profit from it. Candlestick patterns are one of the most popular tools in technical analysis. They...
Some patterns scream for attention, while others sneak up on traders who aren’t looking closely. The diamond pattern is one of those sneaky ones — a formation that hints at a brewing reversal but requires a sharp eye to catch. Let’s dive into this pattern, how it forms, and the best strategies for effectively trading diamond top and bottom patterns. What Is a...
Hello, Traders! 👋🏻 Let’s be honest — wouldn’t it be great if the market had clear signs that screamed, “Hey! The downtrend is over!”? Well, sometimes, it hints. One of those signals is the hammer candlestick pattern — a small but mighty formation that can indicate a shift in momentum. But before you grab a hammer and start breaking things when the market dips,...


