My overall thesis is we are in the very early stages of a multi-year decline ultimately with the S&P 500 below 3500. I have been wrong many times before so I will just take this thing in stages and see if it plays out. After this massive decline, we should be in for a great market rally of many decades. While the market has seen a brief rally, the primary question is when will the rally end? Friday turned in mix answers to that question. The next step in my opinion will be a decline, possibly sharp with a quick bottom in some sectors AHEAD of the reciprocal tariff deadline on April 2.
My wave 3 indicator tends to signal wave 3s and 3 of 3s with additional end of wave (overbought/sold) conditions. See my scripts for the specifics of the indicator. It currently signaled 3 of 3 based on the bottom in mid-March meaning another drop is likely soon.
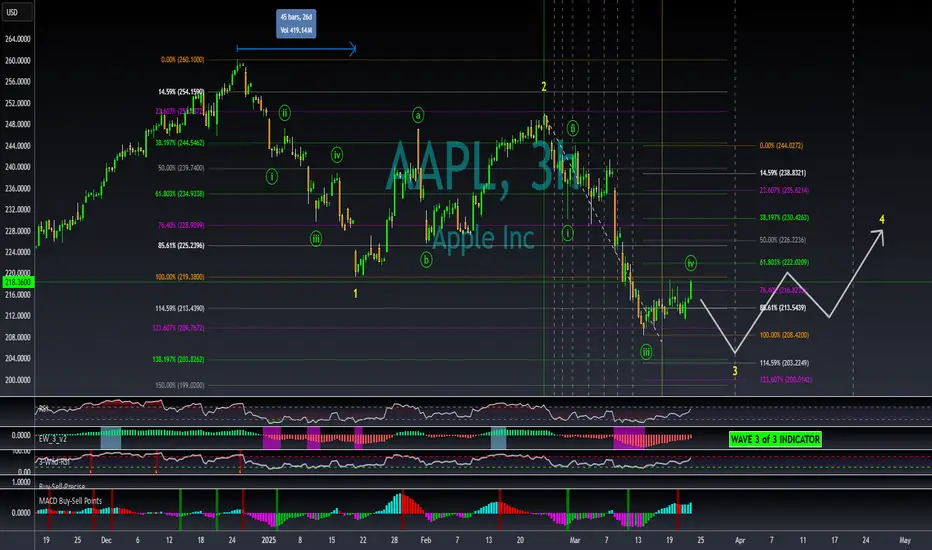
While the other stocks I have studied mainly topped at all-time highs in mid to late February, AAPL topped at the end of 2024. The movement of AAPL may be a leading indicator of future market movement as the market appears to be trading as a micro wave structure inside of AAPL's more macro movement.
My market expectations are for their first semi-major wave 1s to end within the next few weeks. Each wave 1 will be followed by a multi week wave 2 up. AAPL may end its wave 3 structure (yellow 3) when the others finish their wave 1s. AAPL would then experience wave 4 up, when the other stocks and S&P 500 index experience their second wave.
This chart applies select movement extensions based on wave 1's movement on the left and then another based on wave 3's movement on the right. I keep the values between 0%-100% on the chart for wave 2s and 4s retracements of the preceding wave's movement for reference even though the retracement values would be inverted.
I will refer to the yellow waves a Minor waves and the green as Minute waves. The extension/retracement data on the left is based on Minor wave 1's movement and is applicable to Minor waves 2 and 3. It provides a rough location of levels for Minor wave 3 to end. The extension on the right attempts to determine Minute wave 5's end points based on Minute wave 3. An intersection of Minor wave 1 extension levels and Minute wave 3 extension levels are general targets for bottoms. One of these is between 203-204 for AAPL.
Lastly, I apply similar levels to determine Minor wave 3's length based on Minor wave 1's length of 45 bars (on the 3 hour chart). Minor wave 3 is currently longer than 45 bars. The vertical dashed bars provide similar locations with the next vertical bar occurring on the morning of Monday March 31. I am therefore watching to see if the next bottom for AAPL occurs at this time.
If this bottom truly comes into focus, I will then attempt to forecast Minor wave 4 for AAPL which could occur in late April.
My wave 3 indicator tends to signal wave 3s and 3 of 3s with additional end of wave (overbought/sold) conditions. See my scripts for the specifics of the indicator. It currently signaled 3 of 3 based on the bottom in mid-March meaning another drop is likely soon.
While the other stocks I have studied mainly topped at all-time highs in mid to late February, AAPL topped at the end of 2024. The movement of AAPL may be a leading indicator of future market movement as the market appears to be trading as a micro wave structure inside of AAPL's more macro movement.
My market expectations are for their first semi-major wave 1s to end within the next few weeks. Each wave 1 will be followed by a multi week wave 2 up. AAPL may end its wave 3 structure (yellow 3) when the others finish their wave 1s. AAPL would then experience wave 4 up, when the other stocks and S&P 500 index experience their second wave.
This chart applies select movement extensions based on wave 1's movement on the left and then another based on wave 3's movement on the right. I keep the values between 0%-100% on the chart for wave 2s and 4s retracements of the preceding wave's movement for reference even though the retracement values would be inverted.
I will refer to the yellow waves a Minor waves and the green as Minute waves. The extension/retracement data on the left is based on Minor wave 1's movement and is applicable to Minor waves 2 and 3. It provides a rough location of levels for Minor wave 3 to end. The extension on the right attempts to determine Minute wave 5's end points based on Minute wave 3. An intersection of Minor wave 1 extension levels and Minute wave 3 extension levels are general targets for bottoms. One of these is between 203-204 for AAPL.
Lastly, I apply similar levels to determine Minor wave 3's length based on Minor wave 1's length of 45 bars (on the 3 hour chart). Minor wave 3 is currently longer than 45 bars. The vertical dashed bars provide similar locations with the next vertical bar occurring on the morning of Monday March 31. I am therefore watching to see if the next bottom for AAPL occurs at this time.
If this bottom truly comes into focus, I will then attempt to forecast Minor wave 4 for AAPL which could occur in late April.
All forecasts are based on analysis of past behavior. Prior movements are not always indicative of future movement. Develop the theory, test the theory. Do your own research. Nothing in this analysis constitutes advice. YouTube For More. Good luck!!
Related publications
Disclaimer
The information and publications are not meant to be, and do not constitute, financial, investment, trading, or other types of advice or recommendations supplied or endorsed by TradingView. Read more in the Terms of Use.