https://www.tradingview.com/chart/kNybgM0i/
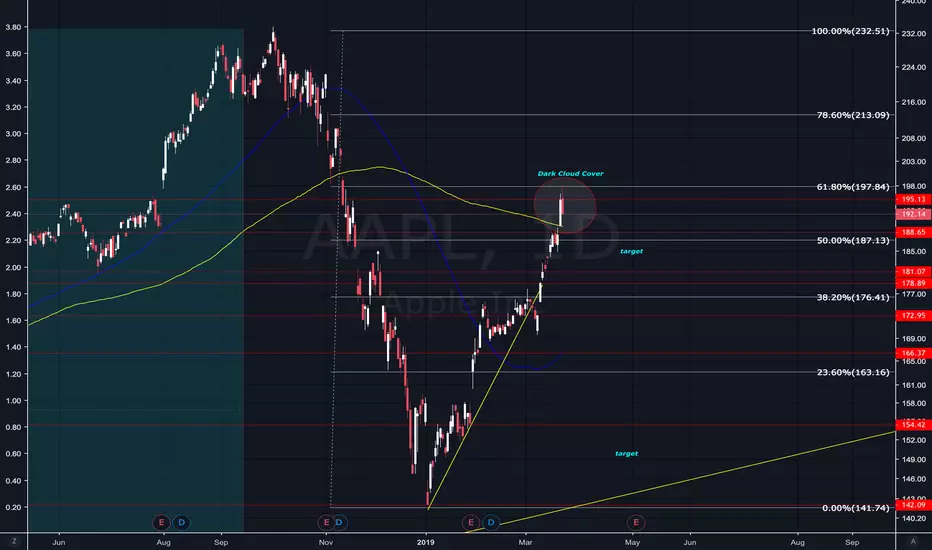
As chart indicates, Possible dark cloud cover on daily. Confirm after closing bell. Strong possibility of follow through starting next week if US10y continues to drop. DGS10-DTB3 (yield curve) indicates a flat curve and economy prone to recession. A H&S can be observed in many equities.
As chart indicates, Possible dark cloud cover on daily. Confirm after closing bell. Strong possibility of follow through starting next week if US10y continues to drop. DGS10-DTB3 (yield curve) indicates a flat curve and economy prone to recession. A H&S can be observed in many equities.
Disclaimer
The information and publications are not meant to be, and do not constitute, financial, investment, trading, or other types of advice or recommendations supplied or endorsed by TradingView. Read more in the Terms of Use.
Disclaimer
The information and publications are not meant to be, and do not constitute, financial, investment, trading, or other types of advice or recommendations supplied or endorsed by TradingView. Read more in the Terms of Use.