Daily Timeframe Analysis (Longer View)
1. Trend:
* AAPL is in a strong uptrend, respecting the rising wedge pattern and trading near resistance.
* Price is consolidating at $248–$250, a critical level for direction.
2. Key Levels:
* Resistance: $250.80 (recent high). Breaking above could trigger continuation toward $255.
* Support: $240 (previous consolidation zone) and $235 as a lower support.
3. Indicators:
* EMA 9/21: Price is above both EMAs, signaling continued bullish momentum.
* MACD: Flattening, showing weakening momentum, which could lead to a pullback.
* Volume: Relatively steady but not showing strong buying pressure.

Daily Outlook:
* If AAPL holds above $248, it can test $250.80–$255.
* Failure to hold could lead to a retest of $240 as support.
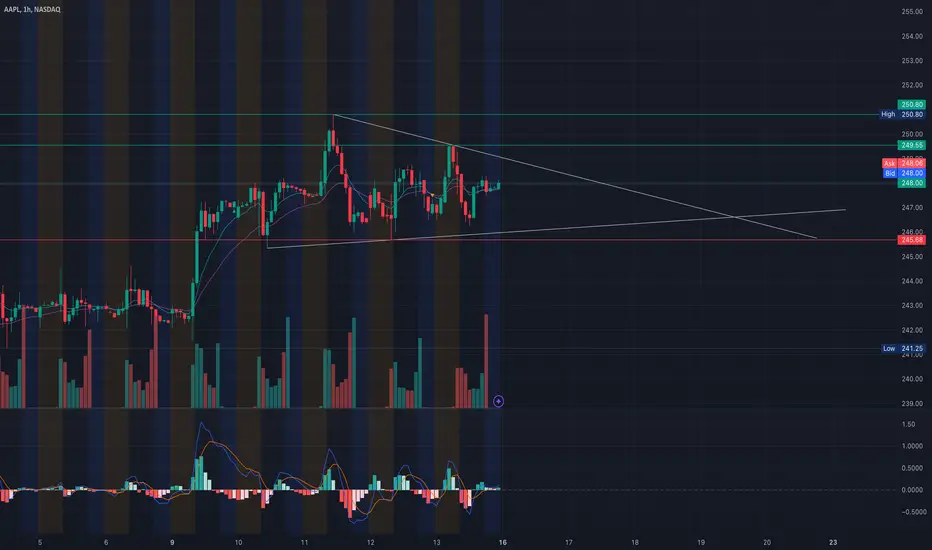
1-Hour Timeframe Analysis (Shorter View)
1. Trend:
* Price is consolidating in a descending triangle, with lower highs and stable support near $246.
* The short-term trend is neutral to slightly bearish, awaiting a breakout or breakdown.
2. Key Levels:
* Resistance: $250.80 (upper trendline).
* Support: $245.68 (lower trendline).
* If $245 breaks, the next level is $241.25 (recent low).
3. Indicators:
* MACD: Bullish crossover forming, suggesting a short-term upside move.
* Volume: Increased red volume shows bears are still active, but buyers are stepping in.
1-Hour Outlook:
* Watch for a breakout above $250 for bullish continuation.
* A breakdown below $245.68 could trigger further downside toward $242.
Direction and Strategy For Tomorrow (Scalping):
* Look for a breakout above $248–$250 to scalp toward $252–$255.
* Short if AAPL rejects resistance at $250 and breaks $246, targeting $243–$245.
For Next Week (Swing Trading):
* Bullish Setup: If AAPL breaks $250.80 with volume, it could rally to $255+.
* Bearish Setup: If it fails to hold $245, look for downside toward $240–$235.
Summary
* Short-term Bias: Neutral to slightly bullish; watch for a breakout or breakdown.
* Key Zones: $250 resistance and $245 support.
* Swing Direction: Needs confirmation above $250 for bullish continuation; failure risks pullback to $240.
-----------------------------
GEX Analysis For Option Trading
-----------------------------

Key Observations from GEX Levels:
1. CALL Walls (Resistance):
* 247.6: The highest positive GEX level, acting as key resistance. This is where upward momentum could slow down or reverse.
* 252.5–255: Additional strong resistance zones, aligning with the 2nd and 3rd CALL Walls.
2. PUT Walls (Support):
* 237.5: The strongest PUT wall and likely the first support level where price could stabilize.
* 225: The 2nd PUT wall—this acts as a deep downside support level.
3. Gamma Sentiment:
* Neutral to Bearish Bias: Gamma exposure shows a balance, with a slight tilt towards the downside due to the PUT wall activity.
* Elevated resistance at 247.6 suggests CALL buyers may cap price movement.
4. IVR and Options Oscillator:
* IVR: 11% indicates low implied volatility, making options relatively cheap for directional plays.
* CALL Positioning: At 17.1%, call positioning is weak, signaling limited bullish momentum.
Technical Analysis for Options Trading (Using GEX):
1. Bearish Option Trade Setup:
* Entry: Look for rejection at 247.6 (CALL wall resistance) or a failed breakout above 252.5.
* Target: First target near the 237.5 PUT support, with an extended target at 225.
* Option Strategy:
* Buy PUT options (near-the-money strikes) with 30–45 days to expiration to allow time for the trade to play out.
* Alternatively, use a Bear Put Spread (e.g., buy 245 PUT, sell 235 PUT) to reduce cost.
2. Bullish Option Trade Setup (Short-Term):
* Entry: If price consolidates above 247.6 with volume confirmation, look for a push toward 252.5.
* Target: CALL wall at 252.5, with stop-loss below 247.
* Option Strategy:
* Buy CALL options with short expiration (0DTE or 1-week out) to capitalize on quick moves.
* Use a Bull Call Spread (e.g., buy 247 CALL, sell 252 CALL) for a cost-effective approach.
Conclusion & Directional Bias:
* Bearish Outlook: Price is struggling near the 247.6 CALL wall, and low IVR suggests options are cheap for PUT strategies.
* Key Levels to Watch:
* Resistance: 247.6 and 252.5
* Support: 237.5 and 225
For options trading, focus on PUT options if rejection occurs at resistance or CALL spreads if bullish confirmation is seen above key levels. 🚀
Short Disclaimer:
This analysis is for educational purposes only and does not constitute financial advice. Always do your own research and manage your risk before trading.
1. Trend:
* AAPL is in a strong uptrend, respecting the rising wedge pattern and trading near resistance.
* Price is consolidating at $248–$250, a critical level for direction.
2. Key Levels:
* Resistance: $250.80 (recent high). Breaking above could trigger continuation toward $255.
* Support: $240 (previous consolidation zone) and $235 as a lower support.
3. Indicators:
* EMA 9/21: Price is above both EMAs, signaling continued bullish momentum.
* MACD: Flattening, showing weakening momentum, which could lead to a pullback.
* Volume: Relatively steady but not showing strong buying pressure.
Daily Outlook:
* If AAPL holds above $248, it can test $250.80–$255.
* Failure to hold could lead to a retest of $240 as support.
1-Hour Timeframe Analysis (Shorter View)
1. Trend:
* Price is consolidating in a descending triangle, with lower highs and stable support near $246.
* The short-term trend is neutral to slightly bearish, awaiting a breakout or breakdown.
2. Key Levels:
* Resistance: $250.80 (upper trendline).
* Support: $245.68 (lower trendline).
* If $245 breaks, the next level is $241.25 (recent low).
3. Indicators:
* MACD: Bullish crossover forming, suggesting a short-term upside move.
* Volume: Increased red volume shows bears are still active, but buyers are stepping in.
1-Hour Outlook:
* Watch for a breakout above $250 for bullish continuation.
* A breakdown below $245.68 could trigger further downside toward $242.
Direction and Strategy For Tomorrow (Scalping):
* Look for a breakout above $248–$250 to scalp toward $252–$255.
* Short if AAPL rejects resistance at $250 and breaks $246, targeting $243–$245.
For Next Week (Swing Trading):
* Bullish Setup: If AAPL breaks $250.80 with volume, it could rally to $255+.
* Bearish Setup: If it fails to hold $245, look for downside toward $240–$235.
Summary
* Short-term Bias: Neutral to slightly bullish; watch for a breakout or breakdown.
* Key Zones: $250 resistance and $245 support.
* Swing Direction: Needs confirmation above $250 for bullish continuation; failure risks pullback to $240.
-----------------------------
GEX Analysis For Option Trading
-----------------------------
Key Observations from GEX Levels:
1. CALL Walls (Resistance):
* 247.6: The highest positive GEX level, acting as key resistance. This is where upward momentum could slow down or reverse.
* 252.5–255: Additional strong resistance zones, aligning with the 2nd and 3rd CALL Walls.
2. PUT Walls (Support):
* 237.5: The strongest PUT wall and likely the first support level where price could stabilize.
* 225: The 2nd PUT wall—this acts as a deep downside support level.
3. Gamma Sentiment:
* Neutral to Bearish Bias: Gamma exposure shows a balance, with a slight tilt towards the downside due to the PUT wall activity.
* Elevated resistance at 247.6 suggests CALL buyers may cap price movement.
4. IVR and Options Oscillator:
* IVR: 11% indicates low implied volatility, making options relatively cheap for directional plays.
* CALL Positioning: At 17.1%, call positioning is weak, signaling limited bullish momentum.
Technical Analysis for Options Trading (Using GEX):
1. Bearish Option Trade Setup:
* Entry: Look for rejection at 247.6 (CALL wall resistance) or a failed breakout above 252.5.
* Target: First target near the 237.5 PUT support, with an extended target at 225.
* Option Strategy:
* Buy PUT options (near-the-money strikes) with 30–45 days to expiration to allow time for the trade to play out.
* Alternatively, use a Bear Put Spread (e.g., buy 245 PUT, sell 235 PUT) to reduce cost.
2. Bullish Option Trade Setup (Short-Term):
* Entry: If price consolidates above 247.6 with volume confirmation, look for a push toward 252.5.
* Target: CALL wall at 252.5, with stop-loss below 247.
* Option Strategy:
* Buy CALL options with short expiration (0DTE or 1-week out) to capitalize on quick moves.
* Use a Bull Call Spread (e.g., buy 247 CALL, sell 252 CALL) for a cost-effective approach.
Conclusion & Directional Bias:
* Bearish Outlook: Price is struggling near the 247.6 CALL wall, and low IVR suggests options are cheap for PUT strategies.
* Key Levels to Watch:
* Resistance: 247.6 and 252.5
* Support: 237.5 and 225
For options trading, focus on PUT options if rejection occurs at resistance or CALL spreads if bullish confirmation is seen above key levels. 🚀
Short Disclaimer:
This analysis is for educational purposes only and does not constitute financial advice. Always do your own research and manage your risk before trading.
Disclaimer
The information and publications are not meant to be, and do not constitute, financial, investment, trading, or other types of advice or recommendations supplied or endorsed by TradingView. Read more in the Terms of Use.
Disclaimer
The information and publications are not meant to be, and do not constitute, financial, investment, trading, or other types of advice or recommendations supplied or endorsed by TradingView. Read more in the Terms of Use.