📊 Intraday Support & Resistance Levels (15-Minute Interval)
Based on recent technical data, the following are the key support and resistance levels for AARTIIND:
Support Levels:
S1: ₹466.67
S2: ₹464.97
S3: ₹462.22
Resistance Levels:
R1: ₹472.17
R2: ₹473.87
R3: ₹476.62
These levels are derived from Fibonacci pivot point calculations and are pertinent for intraday trading decisions.
📈 Technical Indicators Overview
Trend Analysis: The stock exhibits a bullish trend in the short to mid-term, with resistance noted around ₹486.90 and support near ₹420.40.
Moving Averages: AARTIIND is trading above its 50-day moving average, indicating upward momentum.
Relative Strength Index (RSI): The RSI is approaching overbought territory, suggesting caution for new long positions.
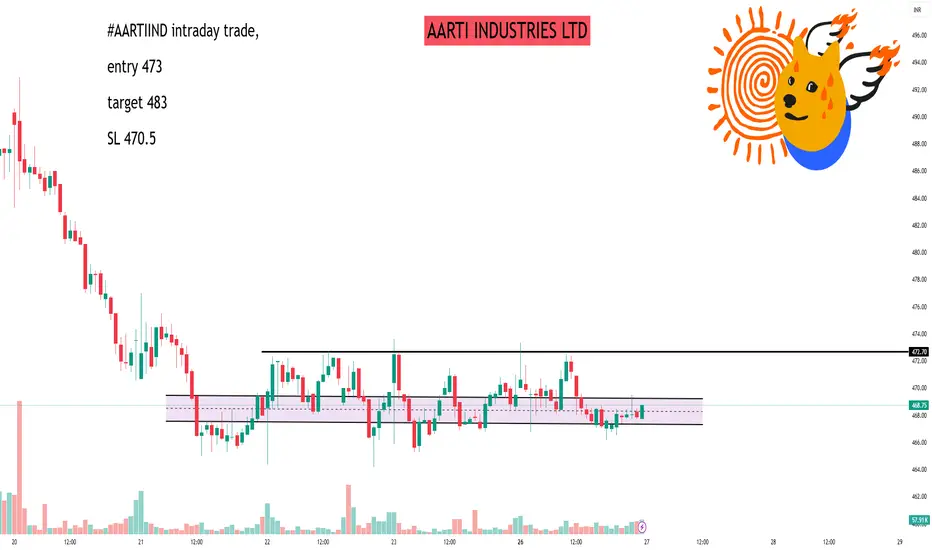
✅ Trading Strategy Suggestions
Long Positions: Consider entering if the price sustains above ₹472.17 (R1) with strong volume, targeting ₹476.62 (R3).
Short Positions: If the price falls below ₹466.67 (S1), it may test lower supports at ₹464.97 (S2) and ₹462.22 (S3).
Stop-Loss Recommendations:
For Long Trades: Place a stop-loss below ₹466.67.
For Short Trades: Place a stop-loss above ₹472.17.
Based on recent technical data, the following are the key support and resistance levels for AARTIIND:
Support Levels:
S1: ₹466.67
S2: ₹464.97
S3: ₹462.22
Resistance Levels:
R1: ₹472.17
R2: ₹473.87
R3: ₹476.62
These levels are derived from Fibonacci pivot point calculations and are pertinent for intraday trading decisions.
📈 Technical Indicators Overview
Trend Analysis: The stock exhibits a bullish trend in the short to mid-term, with resistance noted around ₹486.90 and support near ₹420.40.
Moving Averages: AARTIIND is trading above its 50-day moving average, indicating upward momentum.
Relative Strength Index (RSI): The RSI is approaching overbought territory, suggesting caution for new long positions.
✅ Trading Strategy Suggestions
Long Positions: Consider entering if the price sustains above ₹472.17 (R1) with strong volume, targeting ₹476.62 (R3).
Short Positions: If the price falls below ₹466.67 (S1), it may test lower supports at ₹464.97 (S2) and ₹462.22 (S3).
Stop-Loss Recommendations:
For Long Trades: Place a stop-loss below ₹466.67.
For Short Trades: Place a stop-loss above ₹472.17.
Hello Guys ..
WhatsApp link- wa.link/d997q0
Email - techncialexpress@gmail.com ...
Script Coder/Trader//Investor from India. Drop a comment or DM if you have any questions! Let’s grow together!
WhatsApp link- wa.link/d997q0
Email - techncialexpress@gmail.com ...
Script Coder/Trader//Investor from India. Drop a comment or DM if you have any questions! Let’s grow together!
Related publications
Disclaimer
The information and publications are not meant to be, and do not constitute, financial, investment, trading, or other types of advice or recommendations supplied or endorsed by TradingView. Read more in the Terms of Use.