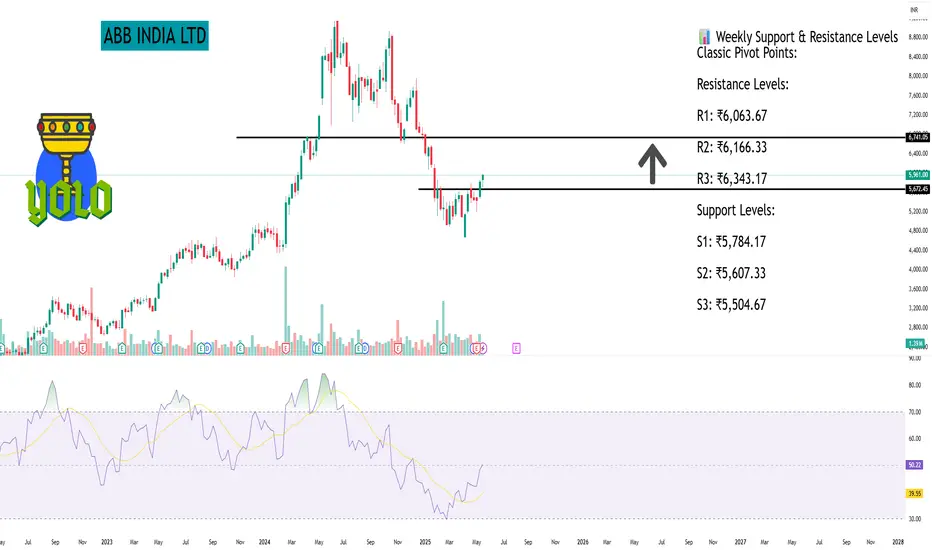
As of May 26, 2025, ABB India Ltd. (NSE: ABB) closed at ₹5,961.00. Here's a comprehensive overview of its weekly support and resistance levels based on technical analysis:
📊 Weekly Support & Resistance Levels
Classic Pivot Points:
Resistance Levels:
R1: ₹6,063.67
R2: ₹6,166.33
R3: ₹6,343.17
Support Levels:
S1: ₹5,784.17
S2: ₹5,607.33
S3: ₹5,504.67
Pivot Point: ₹5,941.83
Fibonacci Pivot Points:
Resistance Levels:
R1: ₹5,985.57
R2: ₹6,012.59
R3: ₹6,056.33
Support Levels:
S1: ₹5,898.09
S2: ₹5,871.07
S3: ₹5,827.33
Pivot Point: ₹5,941.83
Camarilla Pivot Points:
Resistance Levels:
R1: ₹5,971.50
R2: ₹5,981.99
R3: ₹5,992.49
Support Levels:
S1: ₹5,950.50
S2: ₹5,940.01
S3: ₹5,929.51
Pivot Point: ₹5,941.83
🔍 Technical Outlook
Trend: ABB India is exhibiting a neutral to mildly bullish trend.
Key Observations:
The stock is trading near its central pivot point, suggesting potential for either a breakout or a pullback.
A decisive move above R1 levels could indicate bullish momentum, while a drop below S1 may suggest bearish tendencies.
Technical indicators such as RSI are indicating buying momentum, suggesting the stock might rise.
Hello Guys ..
WhatsApp link- wa.link/d997q0
Email - techncialexpress@gmail.com ...
Script Coder/Trader//Investor from India. Drop a comment or DM if you have any questions! Let’s grow together!
WhatsApp link- wa.link/d997q0
Email - techncialexpress@gmail.com ...
Script Coder/Trader//Investor from India. Drop a comment or DM if you have any questions! Let’s grow together!
Related publications
Disclaimer
The information and publications are not meant to be, and do not constitute, financial, investment, trading, or other types of advice or recommendations supplied or endorsed by TradingView. Read more in the Terms of Use.