Head and shoulders
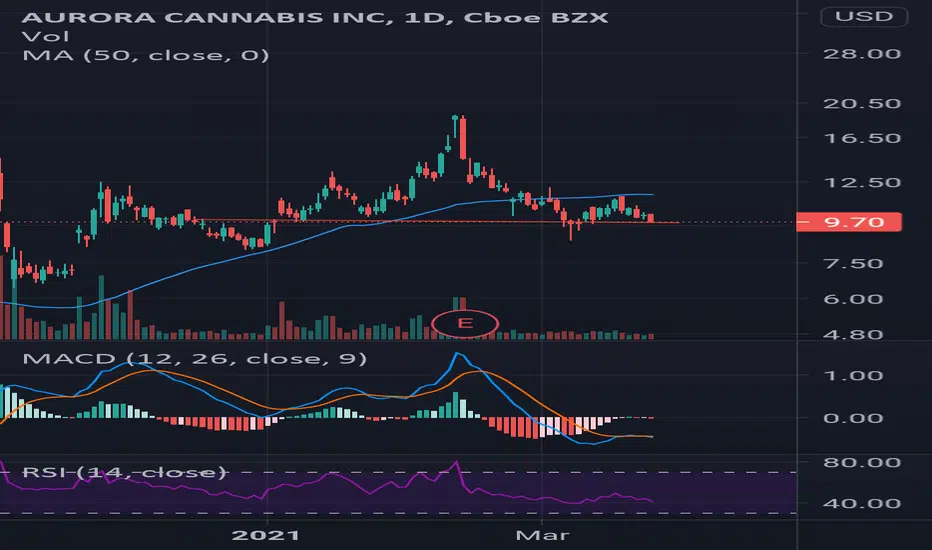
Ive been looking at a lot of charts over the last year. This looks like a clear head and shoulders setup. Price is sitting below the daily 20 and 50 SMA and right on the 200 day SMA. RSI trending down and under 50. MACD averages are negative... But turning up, so there could be hope. A break below the neckline could fill the gaps tbelow $8 and another below $7. A quick measure of the head and shoulders peak to neckline supports a move down this far or further.
Any thoughts that counter or support my observations? Interested to see if others share this view or why my view may not be correct.
Any thoughts that counter or support my observations? Interested to see if others share this view or why my view may not be correct.
Disclaimer
The information and publications are not meant to be, and do not constitute, financial, investment, trading, or other types of advice or recommendations supplied or endorsed by TradingView. Read more in the Terms of Use.
Disclaimer
The information and publications are not meant to be, and do not constitute, financial, investment, trading, or other types of advice or recommendations supplied or endorsed by TradingView. Read more in the Terms of Use.