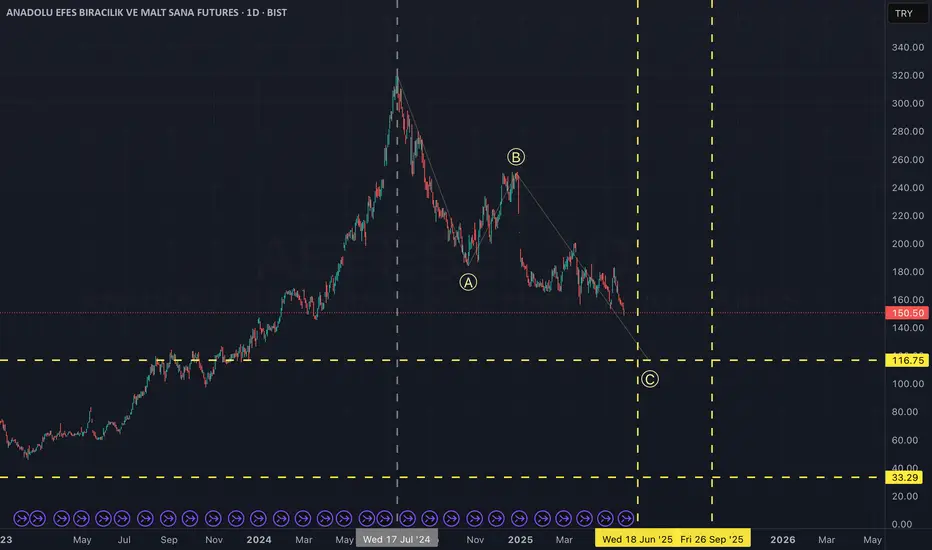
Ee observed an all-time high on July 17, 2025. Since then, the market appears to be undergoing an ABC corrective pattern. Based on the wave structure and proportions, it seems we are currently in the final leg of this correction.
Two potential target zones, both in terms of price and timing, are marked with yellow lines on the chart. In my view, there is a high probability that the correction will conclude before June 18. However, if the final leg deepens further than expected, the completion of this corrective phase could be extended into September.
Two potential target zones, both in terms of price and timing, are marked with yellow lines on the chart. In my view, there is a high probability that the correction will conclude before June 18. However, if the final leg deepens further than expected, the completion of this corrective phase could be extended into September.
Trade active
Since the chart on May 29, with the latest wave starting to take shape, I'm updating the potential reversal zones as shown in the chart. While the gray areas are less probable zones, it's still worth keeping an eye on them.Disclaimer
The information and publications are not meant to be, and do not constitute, financial, investment, trading, or other types of advice or recommendations supplied or endorsed by TradingView. Read more in the Terms of Use.
Disclaimer
The information and publications are not meant to be, and do not constitute, financial, investment, trading, or other types of advice or recommendations supplied or endorsed by TradingView. Read more in the Terms of Use.