Trend Analysis:
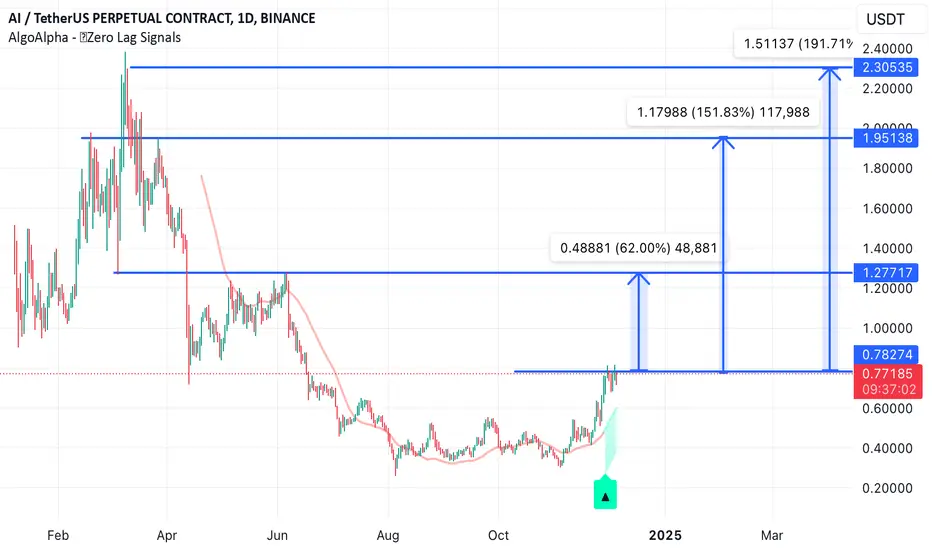
The AI/USDT pair appears to be in a recovery phase after a prolonged downtrend.
A recent bullish signal is visible, suggesting potential upward momentum.
Support and Resistance Levels:
Support: Around the $0.60 region.
Resistance: Key level observed around $1.50, which may act as a psychological barrier.
Technical Indicators:
The chart includes a moving average (possibly a simple or exponential moving average) that recently crossed below price levels, reinforcing a bullish bias.
Zero-lag signal indicator shows a buy signal, aligning with the price's upward trajectory.
Long and midterm term targets are on the chart.
Disclaimer
The information and publications are not meant to be, and do not constitute, financial, investment, trading, or other types of advice or recommendations supplied or endorsed by TradingView. Read more in the Terms of Use.
Disclaimer
The information and publications are not meant to be, and do not constitute, financial, investment, trading, or other types of advice or recommendations supplied or endorsed by TradingView. Read more in the Terms of Use.