As of Friday, June 27, 2025, at 9:09:56 PM PDT, here's an analysis of AMZN:
Current Price & Performance:
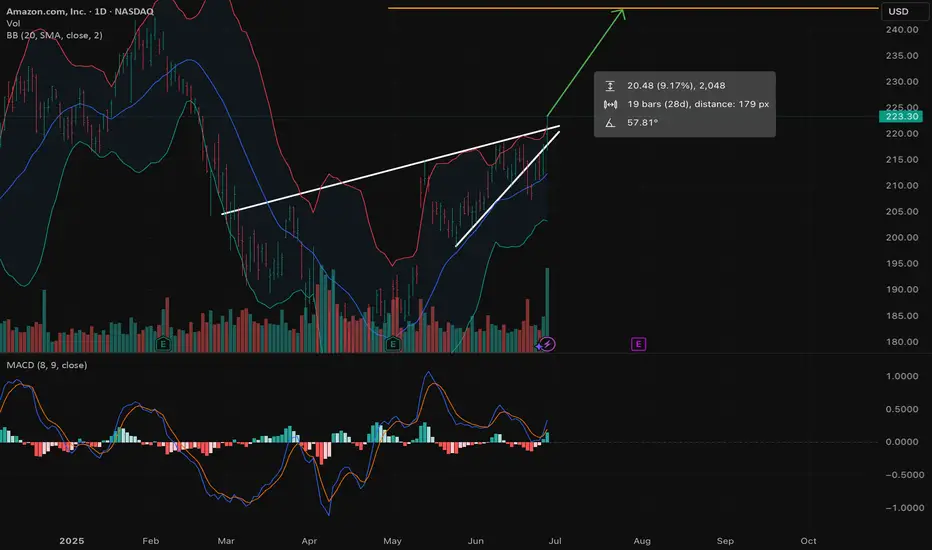
Last Price: $223.30 (as of 4:00 PM ET on June 27, 2025)
Today's Change: Up $6.18 (2.85%)
Previous Close: $217.12
Today's Range: Not explicitly available for today's high/low, but recent trading has been within the range of $211.045 to $223.30.
52-Week Range: $144.05 - $228.88
Bollinger Bands (21-Day Timeframe):
To apply Bollinger Bands correctly, we need three components:
21-Day Simple Moving Average (SMA): This is the middle band.
Upper Bollinger Band: 21-Day SMA + (2 * 21-Day Standard Deviation)
Lower Bollinger Band: 21-Day SMA - (2 * 21-Day Standard Deviation)
Based on available data (which provides a 20-day moving average, often a close proxy for 21-day in such analyses, and general band behavior):
21-Day Simple Moving Average (SMA) / Middle Band: The 20-day moving average is around $212.30. Assuming the 21-day SMA is very similar, this will be our median.
Current Price Position: Amazon's current price of $223.30 is above the 21-day SMA/middle band ($212.30).
Where are we - between the median and the upper band or lower band?
Given that the current price ($223.30) is significantly higher than the 21-day SMA/middle band ($212.30), and considering its recent upward momentum, it's highly likely that AMZN is currently trading between the median (21-day SMA) and the upper Bollinger Band.
Interpretation of Bollinger Bands for AMZN:
Price above the middle band: This generally suggests bullish momentum, indicating that the stock is performing stronger than its recent average.
Moving towards the upper band: When the price approaches or touches the upper band, it can sometimes signal that the stock is becoming overbought in the short term, potentially indicating a pullback or consolidation. However, in a strong uptrend, prices can "walk the band" along the upper limit for an extended period.
Bandwidth: While we don't have the exact standard deviation to calculate the precise upper and lower bands, the fact that the price is moving higher and staying above the middle band suggests that volatility might be increasing, and the bands could be expanding.
Recent News & Outlook:
Amazon recently surged by 6.75% in the five trading days ending June 8, 2025, reaching approximately $211.50 per share. (This was a few weeks ago, and the price has continued to climb since).
Analyst consensus targets are generally optimistic, with a median price target around $240.81.
Strong Q1 2025 results with significant revenue and net income growth underscore operational resilience.
Major investments in cloud infrastructure (AWS) and AI development continue to be key growth drivers.
The stock's upward movement is also being influenced by broader market optimism and positive developments like U.S.-China trade talks (from early June).
In summary, based on the 21-day timeframe and the current price action, AMZN is exhibiting strong bullish momentum and is trading within the upper half of its Bollinger Bands.
Important Considerations for Bollinger Bands:
Bollinger Bands are lagging indicators, meaning they reflect past price action.
They are best used in conjunction with other technical indicators and fundamental analysis.
"Walking the band" can occur during strong trends, so touching the upper band doesn't always immediately mean a reversal.
It's important to consider the overall trend and market context.
Remember, this analysis is for informational purposes only and not financial advice. Always conduct your own research and consult with a financial professional before making investment decisions.
Current Price & Performance:
Last Price: $223.30 (as of 4:00 PM ET on June 27, 2025)
Today's Change: Up $6.18 (2.85%)
Previous Close: $217.12
Today's Range: Not explicitly available for today's high/low, but recent trading has been within the range of $211.045 to $223.30.
52-Week Range: $144.05 - $228.88
Bollinger Bands (21-Day Timeframe):
To apply Bollinger Bands correctly, we need three components:
21-Day Simple Moving Average (SMA): This is the middle band.
Upper Bollinger Band: 21-Day SMA + (2 * 21-Day Standard Deviation)
Lower Bollinger Band: 21-Day SMA - (2 * 21-Day Standard Deviation)
Based on available data (which provides a 20-day moving average, often a close proxy for 21-day in such analyses, and general band behavior):
21-Day Simple Moving Average (SMA) / Middle Band: The 20-day moving average is around $212.30. Assuming the 21-day SMA is very similar, this will be our median.
Current Price Position: Amazon's current price of $223.30 is above the 21-day SMA/middle band ($212.30).
Where are we - between the median and the upper band or lower band?
Given that the current price ($223.30) is significantly higher than the 21-day SMA/middle band ($212.30), and considering its recent upward momentum, it's highly likely that AMZN is currently trading between the median (21-day SMA) and the upper Bollinger Band.
Interpretation of Bollinger Bands for AMZN:
Price above the middle band: This generally suggests bullish momentum, indicating that the stock is performing stronger than its recent average.
Moving towards the upper band: When the price approaches or touches the upper band, it can sometimes signal that the stock is becoming overbought in the short term, potentially indicating a pullback or consolidation. However, in a strong uptrend, prices can "walk the band" along the upper limit for an extended period.
Bandwidth: While we don't have the exact standard deviation to calculate the precise upper and lower bands, the fact that the price is moving higher and staying above the middle band suggests that volatility might be increasing, and the bands could be expanding.
Recent News & Outlook:
Amazon recently surged by 6.75% in the five trading days ending June 8, 2025, reaching approximately $211.50 per share. (This was a few weeks ago, and the price has continued to climb since).
Analyst consensus targets are generally optimistic, with a median price target around $240.81.
Strong Q1 2025 results with significant revenue and net income growth underscore operational resilience.
Major investments in cloud infrastructure (AWS) and AI development continue to be key growth drivers.
The stock's upward movement is also being influenced by broader market optimism and positive developments like U.S.-China trade talks (from early June).
In summary, based on the 21-day timeframe and the current price action, AMZN is exhibiting strong bullish momentum and is trading within the upper half of its Bollinger Bands.
Important Considerations for Bollinger Bands:
Bollinger Bands are lagging indicators, meaning they reflect past price action.
They are best used in conjunction with other technical indicators and fundamental analysis.
"Walking the band" can occur during strong trends, so touching the upper band doesn't always immediately mean a reversal.
It's important to consider the overall trend and market context.
Remember, this analysis is for informational purposes only and not financial advice. Always conduct your own research and consult with a financial professional before making investment decisions.
Disclaimer
The information and publications are not meant to be, and do not constitute, financial, investment, trading, or other types of advice or recommendations supplied or endorsed by TradingView. Read more in the Terms of Use.
Disclaimer
The information and publications are not meant to be, and do not constitute, financial, investment, trading, or other types of advice or recommendations supplied or endorsed by TradingView. Read more in the Terms of Use.