Crystal ball has spoken, AMZN is due for a small DIP.
Trend Analysis:
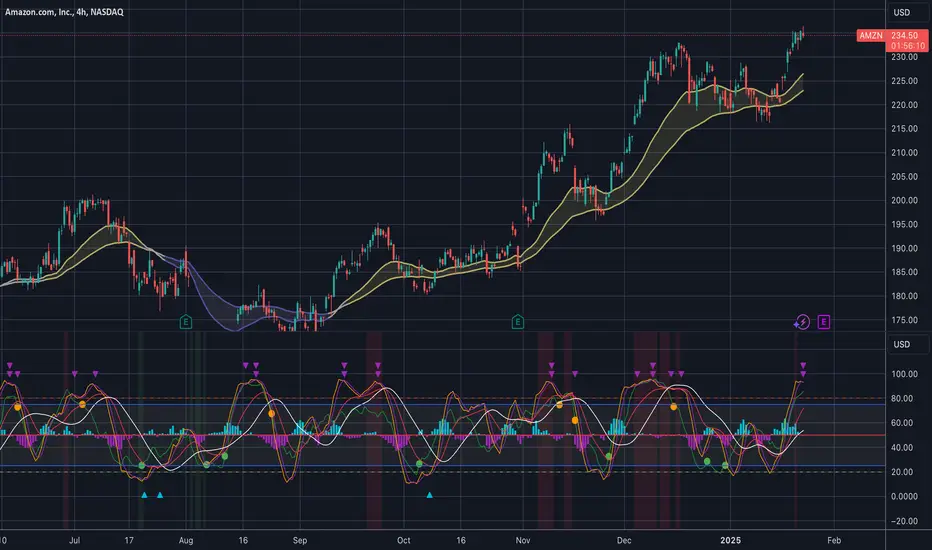
• The price is trading in an overall uptrend, respecting the 50 EMA (yellow) and 20 EMA (gold), indicating strong bullish momentum.
• Recent price action has formed higher highs and higher lows, maintaining bullish structure.
JP StochDemark Indicator Insights:
• The indicator is approaching overbought levels, currently crossing above the 80 threshold, which signals potential exhaustion in the short term.
• Bearish divergence is forming as price makes new highs while the indicator fails to confirm.
• Previous occurrences of such setups led to short-term pullbacks before continuation.
Support & Resistance Levels:
• Immediate resistance at $236-$238, aligning with recent highs.
• Short-term support at $225, where moving averages align.
• Strong demand zone around $210-$215, coinciding with prior consolidation.
Trade Signal & Probability:
Bullish Bias: Continuation likely if price sustains above $230 with momentum confirmation.
Bearish Pullback: A corrective dip to the $225 zone is probable if momentum weakens.
Target Levels: Upside targets at $240 (psychological resistance) and $250 if momentum persists.
Risk Levels: Watch for breakdown below $225, which could trigger further downside to $215.
Conclusion:
Momentum remains bullish but overbought signals suggest caution.
Monitor for a healthy retracement before continuation. A break above $238 could confirm further bullish momentum.
Like the analysis? Follow, Subscribe for more...
Trend Analysis:
• The price is trading in an overall uptrend, respecting the 50 EMA (yellow) and 20 EMA (gold), indicating strong bullish momentum.
• Recent price action has formed higher highs and higher lows, maintaining bullish structure.
JP StochDemark Indicator Insights:
• The indicator is approaching overbought levels, currently crossing above the 80 threshold, which signals potential exhaustion in the short term.
• Bearish divergence is forming as price makes new highs while the indicator fails to confirm.
• Previous occurrences of such setups led to short-term pullbacks before continuation.
Support & Resistance Levels:
• Immediate resistance at $236-$238, aligning with recent highs.
• Short-term support at $225, where moving averages align.
• Strong demand zone around $210-$215, coinciding with prior consolidation.
Trade Signal & Probability:
Bullish Bias: Continuation likely if price sustains above $230 with momentum confirmation.
Bearish Pullback: A corrective dip to the $225 zone is probable if momentum weakens.
Target Levels: Upside targets at $240 (psychological resistance) and $250 if momentum persists.
Risk Levels: Watch for breakdown below $225, which could trigger further downside to $215.
Conclusion:
Momentum remains bullish but overbought signals suggest caution.
Monitor for a healthy retracement before continuation. A break above $238 could confirm further bullish momentum.
Like the analysis? Follow, Subscribe for more...
Disclaimer
The information and publications are not meant to be, and do not constitute, financial, investment, trading, or other types of advice or recommendations supplied or endorsed by TradingView. Read more in the Terms of Use.
Disclaimer
The information and publications are not meant to be, and do not constitute, financial, investment, trading, or other types of advice or recommendations supplied or endorsed by TradingView. Read more in the Terms of Use.