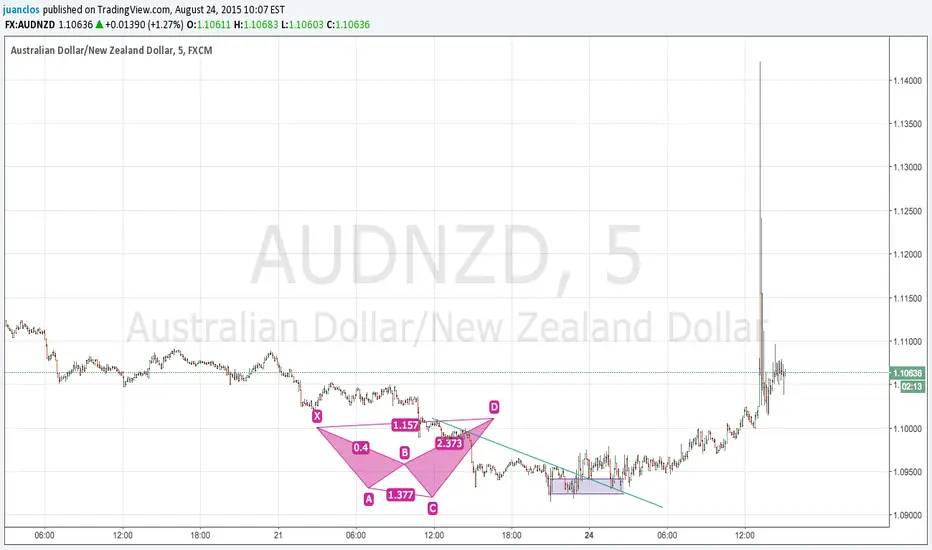
In this chart a bottom is regarded at around 1.093; three factors were the idea behind,
1, the break of a simple downward line with consecutive retest but lack of piercing;
2, downward force diminished, every upturn had fewer and fewer downward pressure, it means bears lost steam, hence the chart starts to look far from the bottom and mostly traded in the upper part;
3, the classical round pattern, at the top signals a downside, at a the bottom, an upside.
The same structure is for a top, keep in mind if it is technical analysis it is valid everywhere at any time.
Disclaimer
The information and publications are not meant to be, and do not constitute, financial, investment, trading, or other types of advice or recommendations supplied or endorsed by TradingView. Read more in the Terms of Use.
Disclaimer
The information and publications are not meant to be, and do not constitute, financial, investment, trading, or other types of advice or recommendations supplied or endorsed by TradingView. Read more in the Terms of Use.