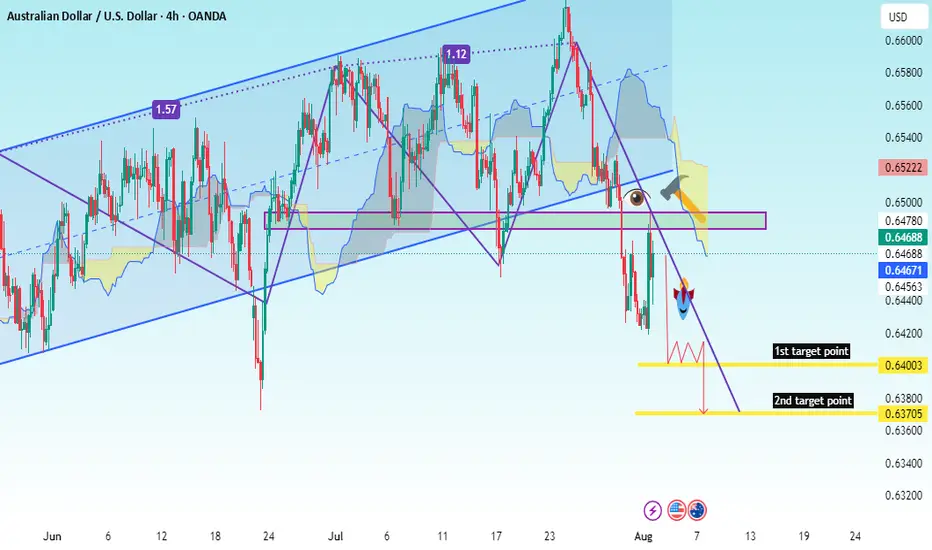
AUD/USD (Australian Dollar vs. US Dollar)
Likely a 4H (4-hour) timeframe based on candlestick density and scale.
---
2. Structure & Patterns:
Rising wedge/ascending channel: Already broken to the downside.
Breakout zone: Around 0.6480–0.6500, clearly marked and now acting as resistance.
Retest confirmed: Price returned to the broken zone, touched resistance, and dropped.
Ichimoku Cloud: Price is below the cloud → strong bearish signal.
Downward projection: You’ve drawn a possible bearish path with lower highs and lower lows.
---
3. Key Support & Target Levels:
✅ Current Price (as per chart):
Around 0.6468
🎯 Target Points (as per your drawing):
1. First Target Point → 0.6400
This aligns with previous minor support.
2. Second Target Point → 0.6370
Likely based on a Fibonacci or historical support level.
---
✅ Clear Trade Setup Summary:
Component Value
Direction Sell (Short)
Entry 0.6475–0.6485
Stop-Loss 0.6520
TP1 0.6400
TP2 0.6370
---
📌 Conclusion:
You are currently in a bearish setup after a breakdown from a rising structure. The market structure favors lower prices with clearly marked TP1 at 0.6400 and TP2 at 0.6370. Your entry zone (0.6475–0.6485) is technically sound, especially if there's a minor retracement.
Let me know if you want:
A Fibonacci analysis
RSI/MACD confirmation
t.me/+cKW-ibvnp_lmYTc0
Forex, gold and crypto signal's with detailed analysis & get consistent results..
t.me/+cKW-ibvnp_lmYTc0
Gold signal's with proper TP & SL for high profits opportunities..
Forex, gold and crypto signal's with detailed analysis & get consistent results..
t.me/+cKW-ibvnp_lmYTc0
Gold signal's with proper TP & SL for high profits opportunities..
Disclaimer
The information and publications are not meant to be, and do not constitute, financial, investment, trading, or other types of advice or recommendations supplied or endorsed by TradingView. Read more in the Terms of Use.
t.me/+cKW-ibvnp_lmYTc0
Forex, gold and crypto signal's with detailed analysis & get consistent results..
t.me/+cKW-ibvnp_lmYTc0
Gold signal's with proper TP & SL for high profits opportunities..
Forex, gold and crypto signal's with detailed analysis & get consistent results..
t.me/+cKW-ibvnp_lmYTc0
Gold signal's with proper TP & SL for high profits opportunities..
Disclaimer
The information and publications are not meant to be, and do not constitute, financial, investment, trading, or other types of advice or recommendations supplied or endorsed by TradingView. Read more in the Terms of Use.