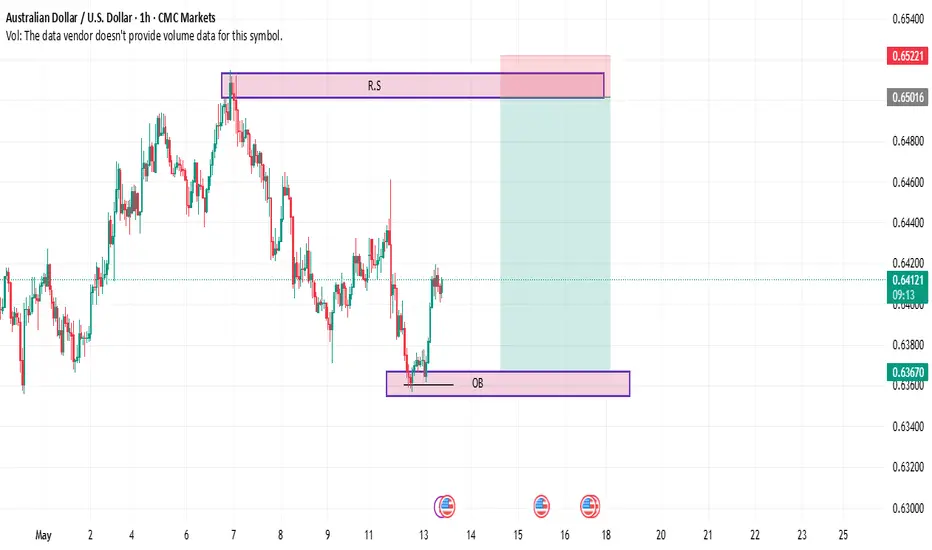
In this 1-hour chart of AUD/USD, we observe a well-defined **Order Block (OB)** at the lower level, acting as a potential demand zone, while a prominent **Resistance/Supply (R.S)** zone appears at the top. The pair recently bounced off the OB area, showing signs of a potential upward move towards the R.S zone. The highlighted green area represents the potential profit zone, while the red zone marks a risk area.
With the recent price action hinting at bullish momentum, traders should watch for reactions around the R.S level to assess whether the trend continues or reverses. Maintaining a balanced risk management strategy is essential in this setup.
With the recent price action hinting at bullish momentum, traders should watch for reactions around the R.S level to assess whether the trend continues or reverses. Maintaining a balanced risk management strategy is essential in this setup.
I Will Sharing Personal Entries &How Trades.
All Of These For Free & I Will Not Take a Penny From Anyone .
So Please My Friends Trade On Your Own Risk
If You Guys Like My Ideas Then Follow Me And Comments Me .
All Of These For Free & I Will Not Take a Penny From Anyone .
So Please My Friends Trade On Your Own Risk
If You Guys Like My Ideas Then Follow Me And Comments Me .
Disclaimer
The information and publications are not meant to be, and do not constitute, financial, investment, trading, or other types of advice or recommendations supplied or endorsed by TradingView. Read more in the Terms of Use.