Overview:
AUDUSD has broken above a key weekly resistance level and is now holding above it, turning the level into support. This suggests a potential shift in higher timeframe structure.
Daily Chart:
The daily chart shows a clear breakout above the weekly resistance zone, followed by a healthy retracement back to retest the new support. Price action is respecting this level so far, reinforcing bullish bias.
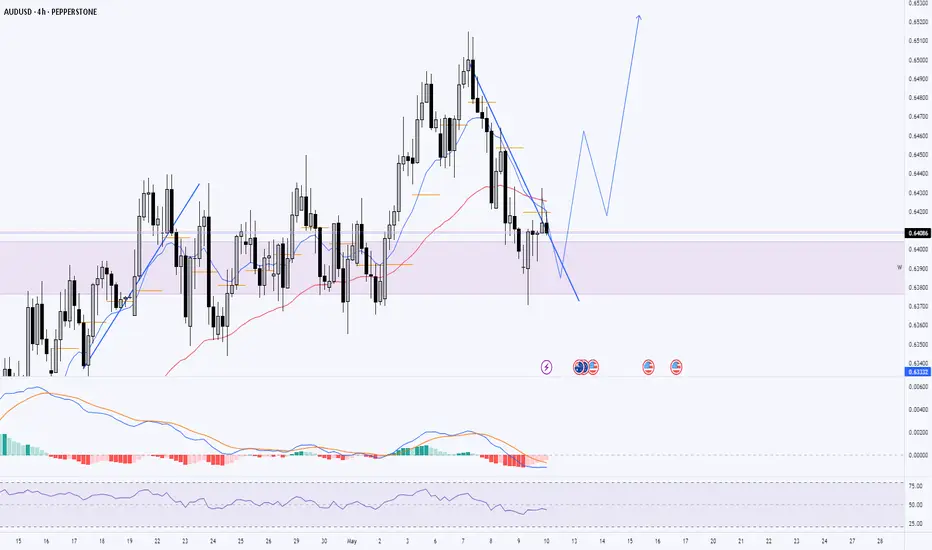
4H Chart:
Despite the higher timeframe bullish structure, the 4H chart remains in a short-term downtrend. However, selling momentum is showing signs of exhaustion—with smaller candles, wicks to the downside, and slowing RSI/MACD signals.
I will wait for a trendline break or a higher low formation to confirm the end of this pullback before entering a buy.
Plan:
✅ Bias: Bullish
🔍 Entry: After confirmation of 4H downtrend break
🎯 Targets: Next resistance zones on daily
📉 Invalidation: If price closes back below weekly support
AUDUSD has broken above a key weekly resistance level and is now holding above it, turning the level into support. This suggests a potential shift in higher timeframe structure.
Daily Chart:
The daily chart shows a clear breakout above the weekly resistance zone, followed by a healthy retracement back to retest the new support. Price action is respecting this level so far, reinforcing bullish bias.
4H Chart:
Despite the higher timeframe bullish structure, the 4H chart remains in a short-term downtrend. However, selling momentum is showing signs of exhaustion—with smaller candles, wicks to the downside, and slowing RSI/MACD signals.
I will wait for a trendline break or a higher low formation to confirm the end of this pullback before entering a buy.
Plan:
✅ Bias: Bullish
🔍 Entry: After confirmation of 4H downtrend break
🎯 Targets: Next resistance zones on daily
📉 Invalidation: If price closes back below weekly support
Note
Monitor closely for a long setup.Note
Long setup is forming, waiting for confirmation to enter.Disclaimer
The information and publications are not meant to be, and do not constitute, financial, investment, trading, or other types of advice or recommendations supplied or endorsed by TradingView. Read more in the Terms of Use.
Disclaimer
The information and publications are not meant to be, and do not constitute, financial, investment, trading, or other types of advice or recommendations supplied or endorsed by TradingView. Read more in the Terms of Use.