As of the market close on May 23, 2025, Bajaj Finance Ltd. (NSE: BAJFINANCE) was trading at ₹9,243.50. Based on recent technical analyses, here are the key daily support and resistance levels:
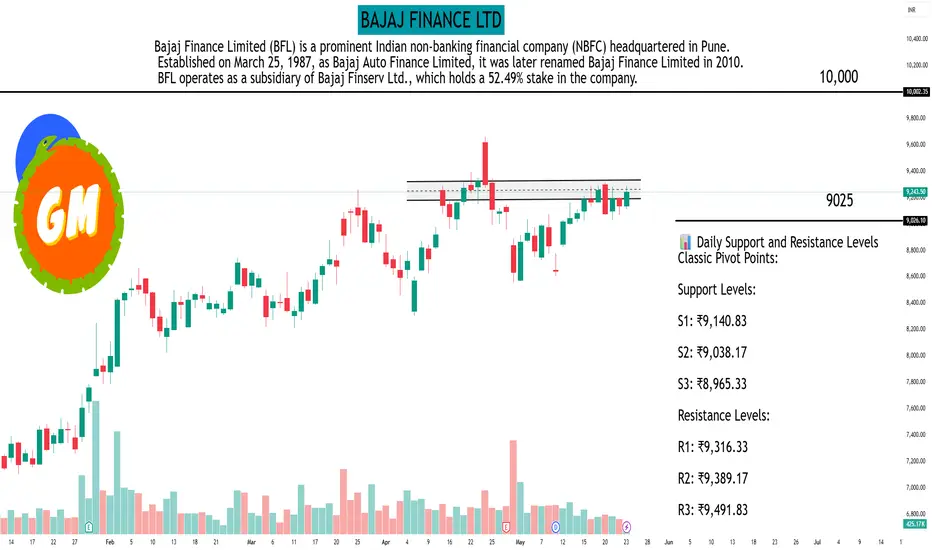
📊 Daily Support and Resistance Levels
Classic Pivot Points:
Support Levels:
S1: ₹9,140.83
S2: ₹9,038.17
S3: ₹8,965.33
Resistance Levels:
R1: ₹9,316.33
R2: ₹9,389.17
R3: ₹9,491.83
Pivot Point: ₹9,213.67
Fibonacci Pivot Points:
Support Levels:
S1: ₹9,146.63
S2: ₹9,105.21
S3: ₹9,038.17
Resistance Levels:
R1: ₹9,280.71
R2: ₹9,322.13
R3: ₹9,389.17
Pivot Point: ₹9,213.67
Camarilla Pivot Points:
Support Levels:
S1: ₹9,227.41
S2: ₹9,211.33
S3: ₹9,195.24
Resistance Levels:
R1: ₹9,259.59
R2: ₹9,275.67
R3: ₹9,291.76
Pivot Point: ₹9,213.67
📈 Technical Indicators Overview
Moving Averages:
20-day EMA: ₹9,046.05
50-day EMA: ₹8,838.25
100-day EMA: ₹8,444.91
200-day EMA: ₹7,961.51
Current Price: ₹9,243.50
Interpretation: The current price is above all major moving averages, indicating a bullish trend.
Technical Summary:
Overall Rating: Strong Buy
Moving Averages: Buy
Technical Indicators: Strong Buy
🔍 Key Observations
The stock is trading above its pivot point and all major moving averages, suggesting bullish
Immediate resistance is observed around ₹9,316.33 (Classic R1), with further resistance at ₹9,389.17 (Classic R2).
Immediate support lies at ₹9,140.83 (Classic S1), with stronger support at ₹9,038.17 (Classic S2).
Please note that these levels are based on historical data and technical analysis, and actual market conditions may vary. It's advisable to use these levels in conjunction with other indicators and market news when making trading decisions.
Hello Guys ..
WhatsApp link- wa.link/d997q0
Email - techncialexpress@gmail.com ...
Script Coder/Trader//Investor from India. Drop a comment or DM if you have any questions! Let’s grow together!
WhatsApp link- wa.link/d997q0
Email - techncialexpress@gmail.com ...
Script Coder/Trader//Investor from India. Drop a comment or DM if you have any questions! Let’s grow together!
Related publications
Disclaimer
The information and publications are not meant to be, and do not constitute, financial, investment, trading, or other types of advice or recommendations supplied or endorsed by TradingView. Read more in the Terms of Use.