Here are the intraday (1-day) support and resistance levels for Bank of India (NSE: BANKINDIA) as of the latest available data:
📊 Price Snapshot (as of May 30, 2025)
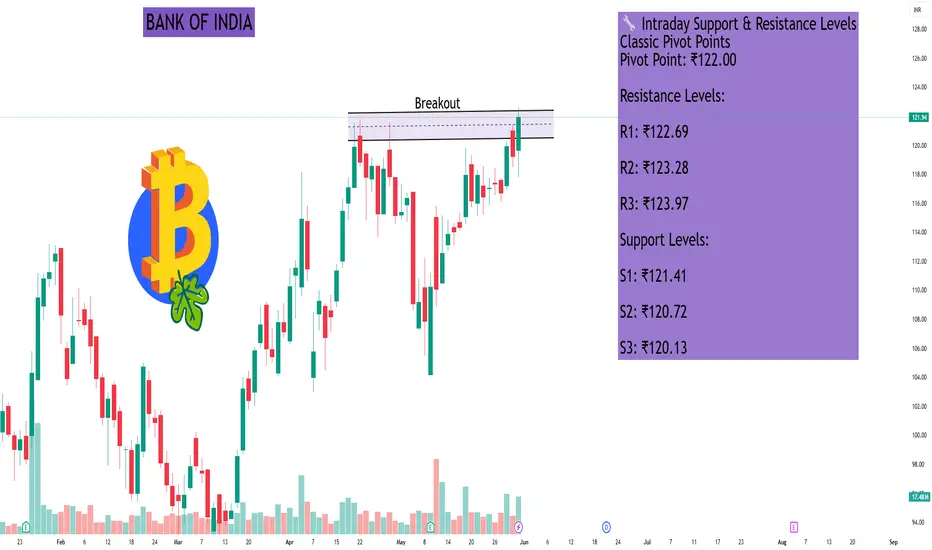
Last Traded Price: ₹121.94
Day’s Range: ₹117.80 – ₹122.61
52-Week Range: ₹90.05 – ₹137.45
Volume: 17,477,465 shares
VWAP: ₹121.03
Market Capitalization: ₹55,515 crore
Beta: 1.21
Dividend Yield: 2.30%
Book Value per Share: ₹162.55
Upper Circuit Limit: ₹131.13
Lower Circuit Limit: ₹107.28
🔧 Intraday Support & Resistance Levels
Classic Pivot Points
Pivot Point: ₹122.00
Resistance Levels:
R1: ₹122.69
R2: ₹123.28
R3: ₹123.97
Support Levels:
S1: ₹121.41
S2: ₹120.72
S3: ₹120.13
Fibonacci Pivot Points
Pivot Point: ₹122.00
Resistance Levels:
R1: ₹122.49
R2: ₹122.79
R3: ₹123.28
Support Levels:
S1: ₹121.51
S2: ₹121.21
S3: ₹120.72
Camarilla Pivot Points
Pivot Point: ₹122.00
Resistance Levels:
R1: ₹122.22
R2: ₹122.33
R3: ₹122.45
Support Levels:
S1: ₹121.98
S2: ₹121.87
S3: ₹121.75
📈 Technical Indicators Summary
Relative Strength Index (RSI): 70.99 (Buy)
MACD (12,26): 0.93 (Buy)
ADX (14): 32.69 (Buy)
Stochastic RSI (14): 92.60 (Overbought)
CCI (14): 191.58 (Buy)
ATR (14): 1.05 (High Volatility)
Williams %R: -13.78 (Overbought)
🧭 Trading Outlook
Trend: Strong Bullish
Recommendation: The stock exhibits a strong bullish trend with multiple technical indicators signaling a 'Buy'. However, the Stochastic RSI and Williams %R indicate overbought conditions, suggesting caution for new entries. Traders should monitor for potential pullbacks or consolidation before initiating new positions.
📊 Price Snapshot (as of May 30, 2025)
Last Traded Price: ₹121.94
Day’s Range: ₹117.80 – ₹122.61
52-Week Range: ₹90.05 – ₹137.45
Volume: 17,477,465 shares
VWAP: ₹121.03
Market Capitalization: ₹55,515 crore
Beta: 1.21
Dividend Yield: 2.30%
Book Value per Share: ₹162.55
Upper Circuit Limit: ₹131.13
Lower Circuit Limit: ₹107.28
🔧 Intraday Support & Resistance Levels
Classic Pivot Points
Pivot Point: ₹122.00
Resistance Levels:
R1: ₹122.69
R2: ₹123.28
R3: ₹123.97
Support Levels:
S1: ₹121.41
S2: ₹120.72
S3: ₹120.13
Fibonacci Pivot Points
Pivot Point: ₹122.00
Resistance Levels:
R1: ₹122.49
R2: ₹122.79
R3: ₹123.28
Support Levels:
S1: ₹121.51
S2: ₹121.21
S3: ₹120.72
Camarilla Pivot Points
Pivot Point: ₹122.00
Resistance Levels:
R1: ₹122.22
R2: ₹122.33
R3: ₹122.45
Support Levels:
S1: ₹121.98
S2: ₹121.87
S3: ₹121.75
📈 Technical Indicators Summary
Relative Strength Index (RSI): 70.99 (Buy)
MACD (12,26): 0.93 (Buy)
ADX (14): 32.69 (Buy)
Stochastic RSI (14): 92.60 (Overbought)
CCI (14): 191.58 (Buy)
ATR (14): 1.05 (High Volatility)
Williams %R: -13.78 (Overbought)
🧭 Trading Outlook
Trend: Strong Bullish
Recommendation: The stock exhibits a strong bullish trend with multiple technical indicators signaling a 'Buy'. However, the Stochastic RSI and Williams %R indicate overbought conditions, suggesting caution for new entries. Traders should monitor for potential pullbacks or consolidation before initiating new positions.
Hello Guys ..
WhatsApp link- wa.link/d997q0
Email - techncialexpress@gmail.com ...
Script Coder/Trader//Investor from India. Drop a comment or DM if you have any questions! Let’s grow together!
WhatsApp link- wa.link/d997q0
Email - techncialexpress@gmail.com ...
Script Coder/Trader//Investor from India. Drop a comment or DM if you have any questions! Let’s grow together!
Related publications
Disclaimer
The information and publications are not meant to be, and do not constitute, financial, investment, trading, or other types of advice or recommendations supplied or endorsed by TradingView. Read more in the Terms of Use.