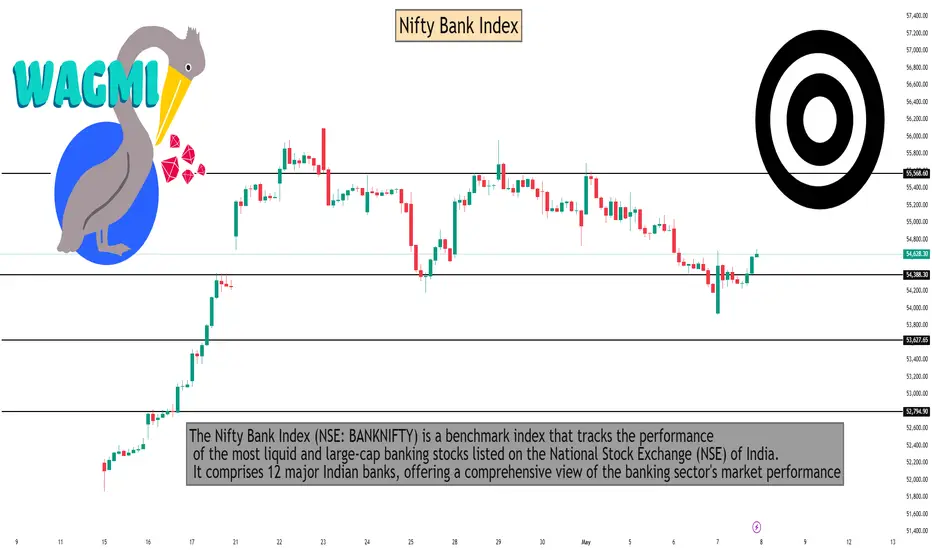
As of May 8, 2025, here are the key intraday support and resistance levels for the Nifty Bank Index (BANKNIFTY), based on various pivot point calculations:
📊 Intraday Support & Resistance Levels
Pivot Type Support Levels Resistance Levels
Classic S1: 54,125.76<br>S2: 53,640.63<br>S3: 53,361.36 R1: 54,890.16<br>R2: 55,169.43<br>R3: 55,654.56
Fibonacci S1: 54,113.03<br>S2: 53,932.63<br>S3: 53,640.63 R1: 54,697.03<br>R2: 54,877.43<br>R3: 55,169.43
Camarilla S1: 54,540.83<br>S2: 54,470.76<br>S3: 54,400.69 R1: 54,680.97<br>R2: 54,751.04<br>R3: 54,821.11
Woodie S1: 54,228.70<br>S2: 53,692.10 R1: 54,993.10<br>R2: 55,220.90
Demark S1: 54,265.40 R1: 55,029.80
Note: The central pivot point (PP) across these methods is approximately 54,405.03.h
🔍 Observations
Immediate Support: The 54,000–54,200 range is a crucial support zone. A breach below this could indicate a bearish trend.
Immediate Resistance: The 54,800–55,200 range serves as a significant resistance area. Sustained trading above this may suggest bullish momentum.
Technical Indicators: The Relative Strength Index (RSI) for Nifty Bank is currently in the neutral zone (45–55), indicating a balanced market without a clear bullish or bearish bias.
📈 Trading Strategy Tips
Bullish Scenario: If the index maintains levels above 54,800, it may target the 55,200–55,650 range.
Bearish Scenario: A drop below 54,000 could lead to further declines toward 53,600 or lower.
Neutral/Bounce Zone: The area between 54,400 and 54,700 is pivotal. Monitoring price action here can provide insights into potential breakouts or reversals
Hello Guys ..
WhatsApp link- wa.link/d997q0
Email - techncialexpress@gmail.com ...
Script Coder/Trader//Investor from India. Drop a comment or DM if you have any questions! Let’s grow together!
WhatsApp link- wa.link/d997q0
Email - techncialexpress@gmail.com ...
Script Coder/Trader//Investor from India. Drop a comment or DM if you have any questions! Let’s grow together!
Related publications
Disclaimer
The information and publications are not meant to be, and do not constitute, financial, investment, trading, or other types of advice or recommendations supplied or endorsed by TradingView. Read more in the Terms of Use.