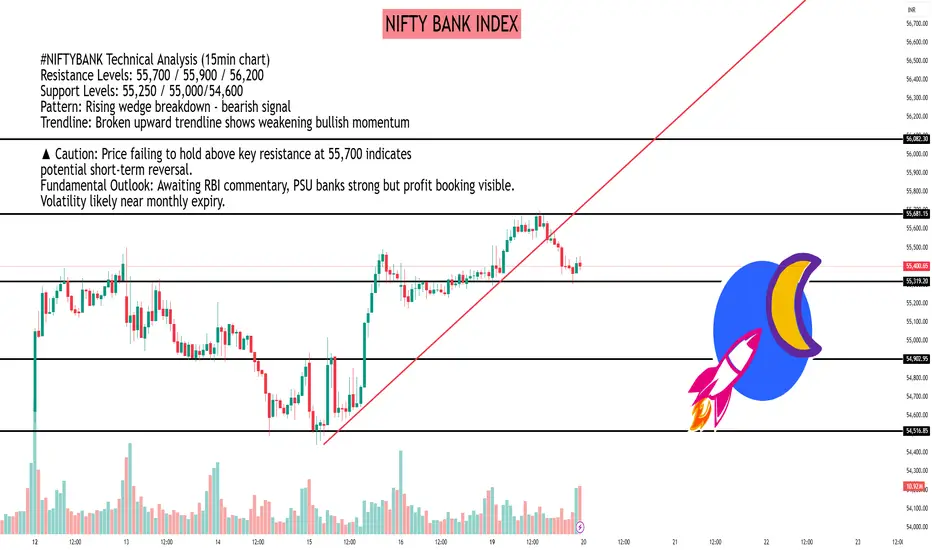
#NIFTYBANK Technical Analysis (15min chart)
Resistance Levels: 55,700 / 55,900 / 56,200
Support Levels: 55,250 / 55,000/54,600
Pattern: Rising wedge breakdown - bearish signal
Trendline: Broken upward trendline shows weakening bullish momentum
▲ Caution: Price failing to hold above key resistance at 55,700 indicates
potential short-term reversal.
Fundamental Outlook: Awaiting RBI commentary, PSU banks strong but profit booking visible. Volatility likely near monthly expiry.
Hello Guys ..
WhatsApp link- wa.link/d997q0
Email - techncialexpress@gmail.com ...
Script Coder/Trader//Investor from India. Drop a comment or DM if you have any questions! Let’s grow together!
WhatsApp link- wa.link/d997q0
Email - techncialexpress@gmail.com ...
Script Coder/Trader//Investor from India. Drop a comment or DM if you have any questions! Let’s grow together!
Related publications
Disclaimer
The information and publications are not meant to be, and do not constitute, financial, investment, trading, or other types of advice or recommendations supplied or endorsed by TradingView. Read more in the Terms of Use.