NIFTY BANK Index – 1-Day Timeframe Analysis
Technical Structure:
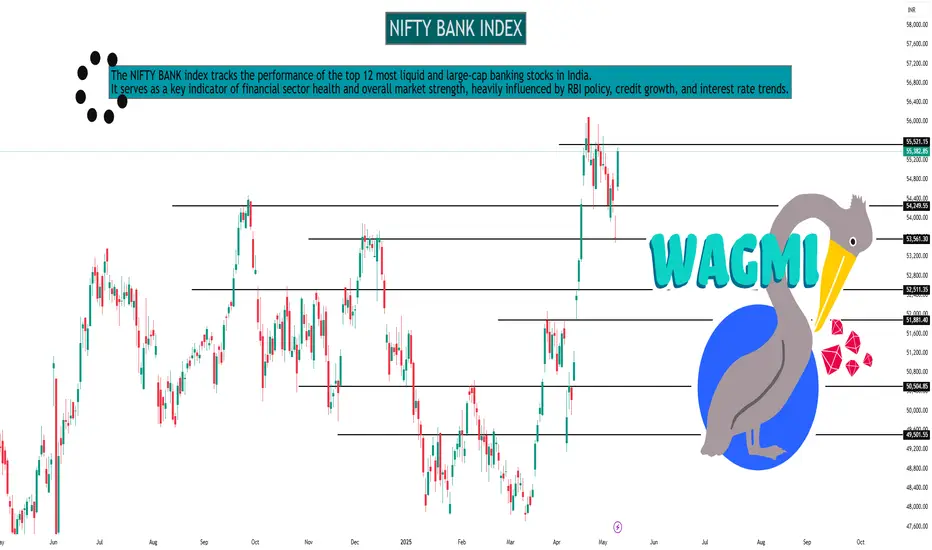
Trend: Bullish with minor consolidation near highs
Price Action: Sustaining above key moving averages; forming a bullish flag
Support Levels: 48,000 / 47,300
Resistance Levels: 49,500 / 50,000
Indicators:
RSI: Around 66 – healthy bullish momentum
MACD: Positive and widening – confirms upward trend
Volume: Steady on up-days; slight dip on pullbacks
Outlook:
Holding above 48,000 keeps bulls in control. A breakout above 49,500 may trigger fresh upside toward 50,500+. Watch for volatility around RBI or macro events.
Technical Structure:
Trend: Bullish with minor consolidation near highs
Price Action: Sustaining above key moving averages; forming a bullish flag
Support Levels: 48,000 / 47,300
Resistance Levels: 49,500 / 50,000
Indicators:
RSI: Around 66 – healthy bullish momentum
MACD: Positive and widening – confirms upward trend
Volume: Steady on up-days; slight dip on pullbacks
Outlook:
Holding above 48,000 keeps bulls in control. A breakout above 49,500 may trigger fresh upside toward 50,500+. Watch for volatility around RBI or macro events.
Hello Guys ..
WhatsApp link- wa.link/d997q0
Email - techncialexpress@gmail.com ...
Script Coder/Trader//Investor from India. Drop a comment or DM if you have any questions! Let’s grow together!
WhatsApp link- wa.link/d997q0
Email - techncialexpress@gmail.com ...
Script Coder/Trader//Investor from India. Drop a comment or DM if you have any questions! Let’s grow together!
Related publications
Disclaimer
The information and publications are not meant to be, and do not constitute, financial, investment, trading, or other types of advice or recommendations supplied or endorsed by TradingView. Read more in the Terms of Use.