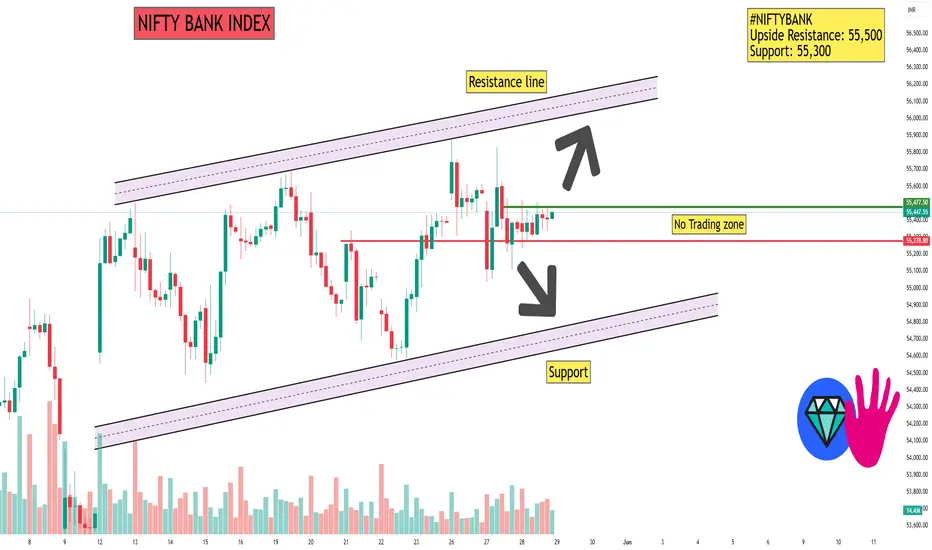
📊 1-Hour Support & Resistance Levels (Classic Pivot Points)
Based on the latest technical analysis, the key support and resistance levels for the Nifty Bank Index on a 1-hour timeframe are:
Support Levels:
S1: ₹55,261.10
S2: ₹55,105.20
S3: ₹54,974.85
Resistance Levels:
R1: ₹55,547.35
R2: ₹55,677.70
R3: ₹55,833.60
These levels are derived from the price range of the previous trading day.
🔍 Technical Indicators Overview
Relative Strength Index (RSI): Currently, the RSI is hovering around 60, indicating a neutral to slightly bullish momentum.
Moving Averages: The index is trading above its 5-day and 10-day simple moving averages, suggesting a short-term bullish trend.
MACD (12,26): The MACD line is above the signal line, indicating positive momentum.
📈 Market Sentiment
The technical indicators collectively suggest a cautiously bullish sentiment for the Nifty Bank Index. However, the RSI indicates that the index is approaching overbought territory, which may lead to a short-term correction. Investors should monitor the support and resistance levels closely for potential breakout or pullback scenarios.
Please note that stock market investments are subject to market risks, and it's essential to conduct thorough research or consult with a financial advisor before making investment decisions.
Hello Guys ..
WhatsApp link- wa.link/d997q0
Email - techncialexpress@gmail.com ...
Script Coder/Trader//Investor from India. Drop a comment or DM if you have any questions! Let’s grow together!
WhatsApp link- wa.link/d997q0
Email - techncialexpress@gmail.com ...
Script Coder/Trader//Investor from India. Drop a comment or DM if you have any questions! Let’s grow together!
Related publications
Disclaimer
The information and publications are not meant to be, and do not constitute, financial, investment, trading, or other types of advice or recommendations supplied or endorsed by TradingView. Read more in the Terms of Use.