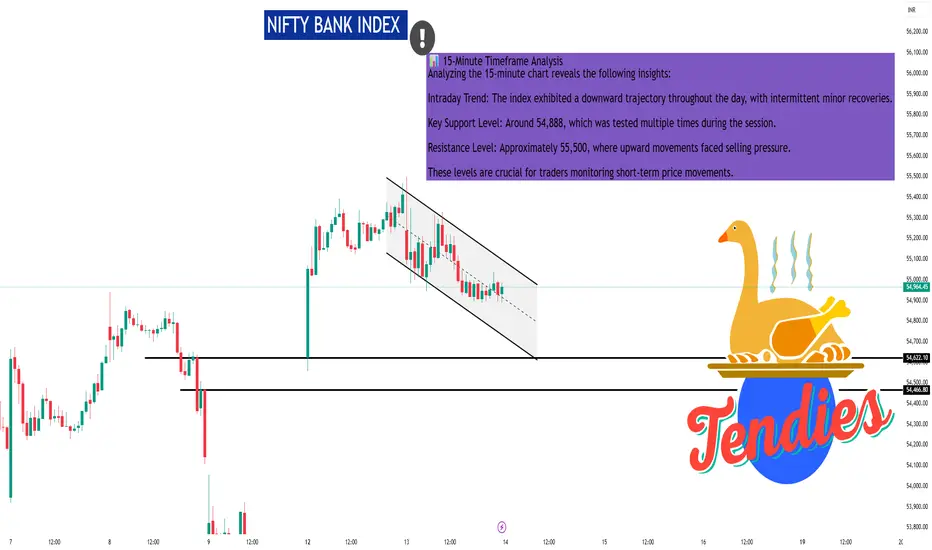
#NIFTYBANK Analysis (15-min Chart)
• Pattern: Falling Wedge () - Bullish reversal potential if breakout above resistance occurs.
• Resistance:
• 55,000 (psychological & upper wedge line)
• 55,400 - recent swing high
• Support:
54,800 wedge support zone
54,020 - previous gap-fill & demand zone
Note: Watch for volume spike & wedge breakout confirmation for long entry.
Hello Guys ..
WhatsApp link- wa.link/d997q0
Email - techncialexpress@gmail.com ...
Script Coder/Trader//Investor from India. Drop a comment or DM if you have any questions! Let’s grow together!
WhatsApp link- wa.link/d997q0
Email - techncialexpress@gmail.com ...
Script Coder/Trader//Investor from India. Drop a comment or DM if you have any questions! Let’s grow together!
Related publications
Disclaimer
The information and publications are not meant to be, and do not constitute, financial, investment, trading, or other types of advice or recommendations supplied or endorsed by TradingView. Read more in the Terms of Use.