As of May 17, 2025, here are the key 4-hour support and resistance levels for the Nifty Bank Index (BANKNIFTY), based on recent technical analyses:
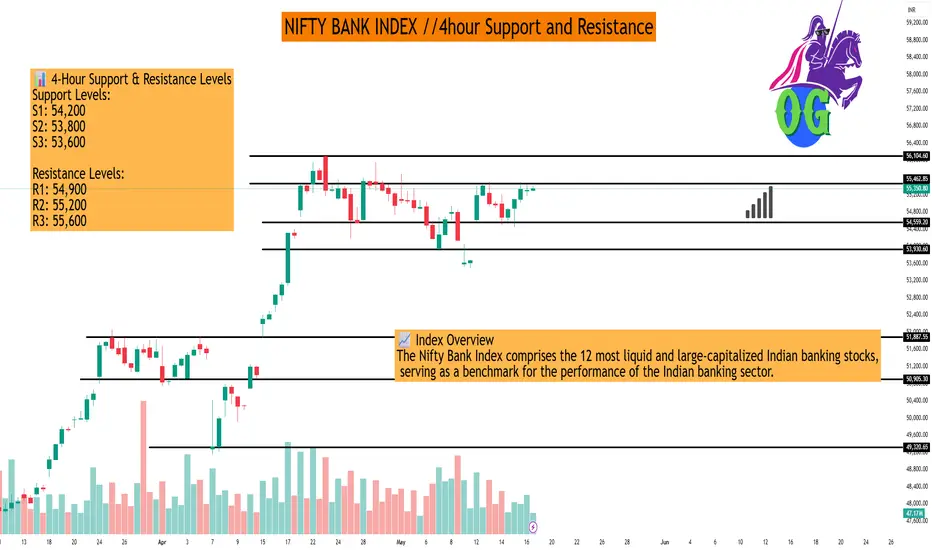
📊 4-Hour Support & Resistance Levels
Support Levels:
S1: 54,200
S2: 53,800
S3: 53,600
Resistance Levels:
R1: 54,900
R2: 55,200
R3: 55,600
These levels are derived from recent price actions and technical indicators, indicating potential zones where the index might find buying or selling pressure.
📈 Exponential Moving Averages (EMA) on 4-Hour Chart
EMA 50: 54,750
EMA 100: 54,400
EMA 200: 54,000
EMA 400: 53,600
These EMAs can act as dynamic support or resistance levels, providing insights into the index's short to medium-term trend.
🔍 Technical Outlook
Trend: The 4-hour timeframe indicates a bullish trend, with the index trading above key EMAs.
Momentum Indicators: Indicators such as RSI and MACD suggest positive momentum, supporting the bullish outlook.
Price Action: The index has recently bounced from the 54,500 support zone, indicating buying interest at lower levels.
📌 Summary
Immediate Support: 54,200
Immediate Resistance: 54,900
Trend: Bullish on 4-hour timeframe
Traders should monitor these levels closely, as a break above resistance could signal further upside, while a drop below support might indicate a potential reversal or consolidation.
If you need more detailed analysis or information on specific indicators, feel free to ask!
Hello Guys ..
WhatsApp link- wa.link/d997q0
Email - techncialexpress@gmail.com ...
Script Coder/Trader//Investor from India. Drop a comment or DM if you have any questions! Let’s grow together!
WhatsApp link- wa.link/d997q0
Email - techncialexpress@gmail.com ...
Script Coder/Trader//Investor from India. Drop a comment or DM if you have any questions! Let’s grow together!
Related publications
Disclaimer
The information and publications are not meant to be, and do not constitute, financial, investment, trading, or other types of advice or recommendations supplied or endorsed by TradingView. Read more in the Terms of Use.