Patience is indeed a virtue when the correction is extended like this, but then again, why should it not be extended after a 200% hike in price in less than a week timeframe. Is there a turnaround?
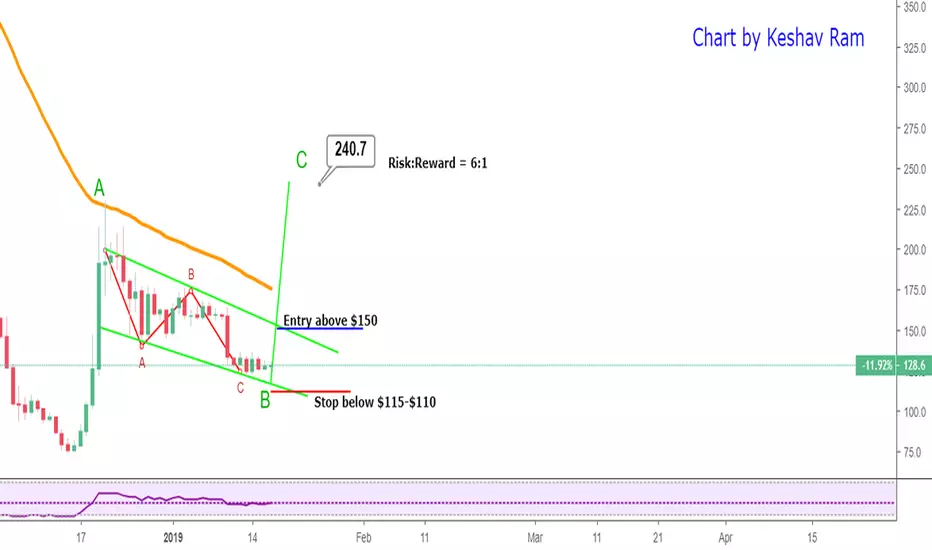
A bull flag appears to have formed on the 1Day chart, confirmation is above $150 and $240 target is the length of the pole. However the 50 Day EMA (Orange) will offer major resistance at $175.
This chart pattern also coincides with ABC (green) waves upwards that we have been looking for since we made bottom on Dec15. Observe that the Red ABC correction is done (or almost done)
--------------------
A falling wedge can be seen on the 12Hour chart, confirmation is above $140 and targets are similar.

Note that there could be a quick drop to $120-$110 and then a bounce. Any movement below that we may have a double bottom, more clarity in the next few days
Previous post -

A bull flag appears to have formed on the 1Day chart, confirmation is above $150 and $240 target is the length of the pole. However the 50 Day EMA (Orange) will offer major resistance at $175.
This chart pattern also coincides with ABC (green) waves upwards that we have been looking for since we made bottom on Dec15. Observe that the Red ABC correction is done (or almost done)
--------------------
A falling wedge can be seen on the 12Hour chart, confirmation is above $140 and targets are similar.
Note that there could be a quick drop to $120-$110 and then a bounce. Any movement below that we may have a double bottom, more clarity in the next few days
Previous post -
Note
Here is the post to track a short-term drop in price within the above charts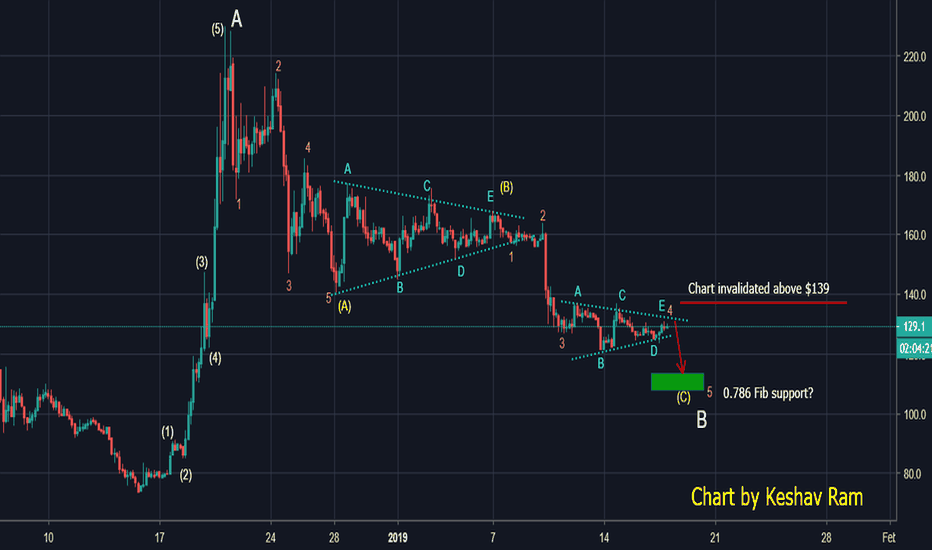
Follow me for more updates
twitter.com/imkeshav
youtube.com/channel/UCskbBdZstBUQ_4y2o912zzw
twitter.com/imkeshav
youtube.com/channel/UCskbBdZstBUQ_4y2o912zzw
Related publications
Disclaimer
The information and publications are not meant to be, and do not constitute, financial, investment, trading, or other types of advice or recommendations supplied or endorsed by TradingView. Read more in the Terms of Use.