Bulls (Optimistic MidTerm):
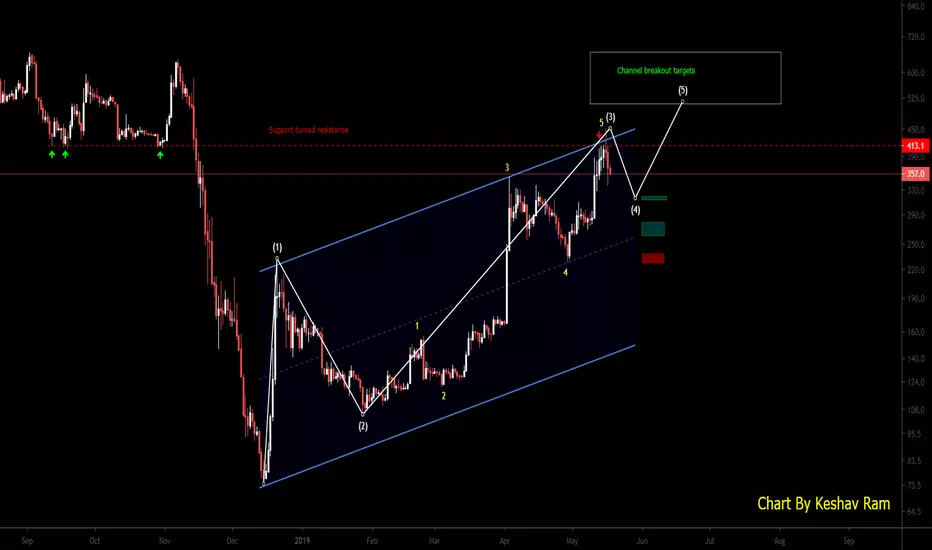
The recent uptrend marks the completion of 5 waves (yellow). This can be considered as the completion of 3rd wave (white) since the bottom in Dec '18. With that assumption, price is correcting as part of 4th wave and then there will be a move to new highs with targets between 500-600+
The 3 boxes represent the areas of support where 4th wave can end -
1) $320 area - 0.386 Fib+300 DMA
2) $270-$290 area - 0.5 Fib/ 50 DMA
3) $230 area - 0.618 Fib (redbox)
This bullish count is invalidated if price goes < $230 (white wave 4 can't go below wave 1)
Final confirmation for this chart is >$450 (5th wave goes above 3rd wave)
Be safe about the 5th wave, most retailers tend to FOMO and don't take profits
Bulls Long term (Super optimistic, Bottom@$75):
This assumes that 1st wave (green) is in and we are now correcting as wave 2. Technically wave 2 can correct as deep at $80. But expecting support at 0.618 Fib area ($230). The assumption is we keep on making Higher Lows and Higher Highs, a very optimistic scenario where bottom is at $75

Bears (Pessimistic):
This assumes that bottom was NOT in Dec'18 and we may retest that low or make a lower low. The count is a 3 wave ABC (green) uptrend ending at $450 which marks that its a dead cat bounce/bull trap. We just finished the 5 yellow subwaves of wave C, which is followed by a 5 wave (red) downward move

The recent uptrend marks the completion of 5 waves (yellow). This can be considered as the completion of 3rd wave (white) since the bottom in Dec '18. With that assumption, price is correcting as part of 4th wave and then there will be a move to new highs with targets between 500-600+
The 3 boxes represent the areas of support where 4th wave can end -
1) $320 area - 0.386 Fib+300 DMA
2) $270-$290 area - 0.5 Fib/ 50 DMA
3) $230 area - 0.618 Fib (redbox)
This bullish count is invalidated if price goes < $230 (white wave 4 can't go below wave 1)
Final confirmation for this chart is >$450 (5th wave goes above 3rd wave)
Be safe about the 5th wave, most retailers tend to FOMO and don't take profits
Bulls Long term (Super optimistic, Bottom@$75):
This assumes that 1st wave (green) is in and we are now correcting as wave 2. Technically wave 2 can correct as deep at $80. But expecting support at 0.618 Fib area ($230). The assumption is we keep on making Higher Lows and Higher Highs, a very optimistic scenario where bottom is at $75
Bears (Pessimistic):
This assumes that bottom was NOT in Dec'18 and we may retest that low or make a lower low. The count is a 3 wave ABC (green) uptrend ending at $450 which marks that its a dead cat bounce/bull trap. We just finished the 5 yellow subwaves of wave C, which is followed by a 5 wave (red) downward move
Note
Here is another short-term bullish scenario that was brought to my attention. But note that we appear to be in the 5th subwave of the 5th wave (white), so hard to guess where this rally endsTargets: $500 (400 DMA)
Extended Target: $650 (500 DMA)
Conservative Target: $450
Note
BCH BTC ratio looks bearish and if the price stays below the red line, we will drop!Note
Update on ST Bull scenario ($500 goal)We made 3 attempts to breakout from the channel and all rejected near the top (red zone). We are in the blue 5th wave of the 5th wave. There is a chance it may make a breakout again.
Trade safe
Zoom In
Need the price to breakout and stay above $450
Note
We maybe finished with an ending 5th wave diagonal, a breakout may push us to $490, but trade safe as this is the 5th wave of 5th waveNote
Alternate countFollow me for more updates
twitter.com/imkeshav
youtube.com/channel/UCskbBdZstBUQ_4y2o912zzw
twitter.com/imkeshav
youtube.com/channel/UCskbBdZstBUQ_4y2o912zzw
Disclaimer
The information and publications are not meant to be, and do not constitute, financial, investment, trading, or other types of advice or recommendations supplied or endorsed by TradingView. Read more in the Terms of Use.
Follow me for more updates
twitter.com/imkeshav
youtube.com/channel/UCskbBdZstBUQ_4y2o912zzw
twitter.com/imkeshav
youtube.com/channel/UCskbBdZstBUQ_4y2o912zzw
Disclaimer
The information and publications are not meant to be, and do not constitute, financial, investment, trading, or other types of advice or recommendations supplied or endorsed by TradingView. Read more in the Terms of Use.