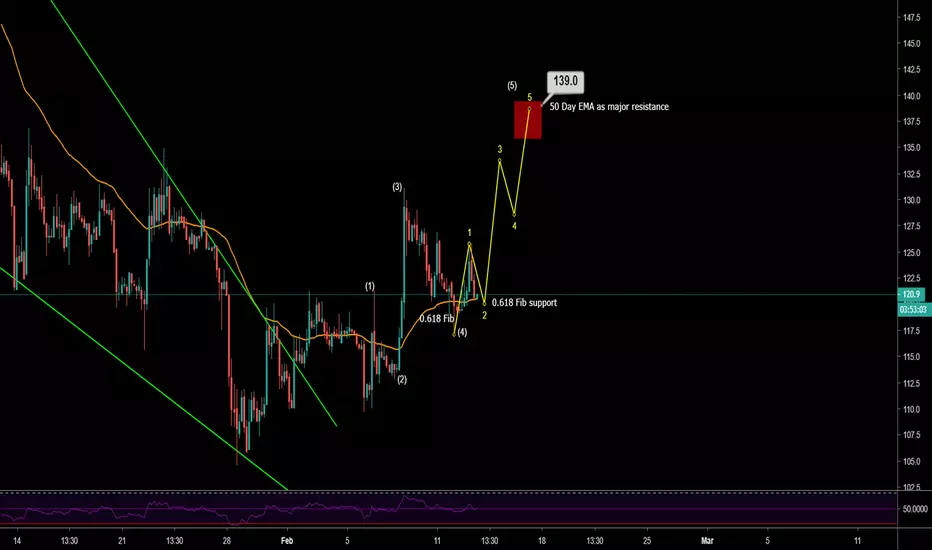
Assuming the recent hike is impulsive, we can assume 5 waves (white) and we appear to be done with the 4th wave considering that we got support at 0.618 Fib region of wave 3 (white) + 4Hour 50 EMA acted as support, and also wave 4 did not go below wave 1 top of the candle (wick overlap in EW is ok)
The final 5th wave can be broken down into 5 sub-waves again (yellow) and as per that we are in the sub-wave 2 (or done with it as 0.618 fib region of wave 1 is acting as support now). Target is around $139, which is 1.618 Fib extension of wave 3 (white) and also 50 Day EMA is here which will act as major resistance.
(BTW The final confirmation for this count is above $131)
This count will be invalid if price goes below yellow wave 1 start at $117, so that is your stop loss
This is a zoomed in view of the chart posted as an update in the below idea. Please click for some context
Note
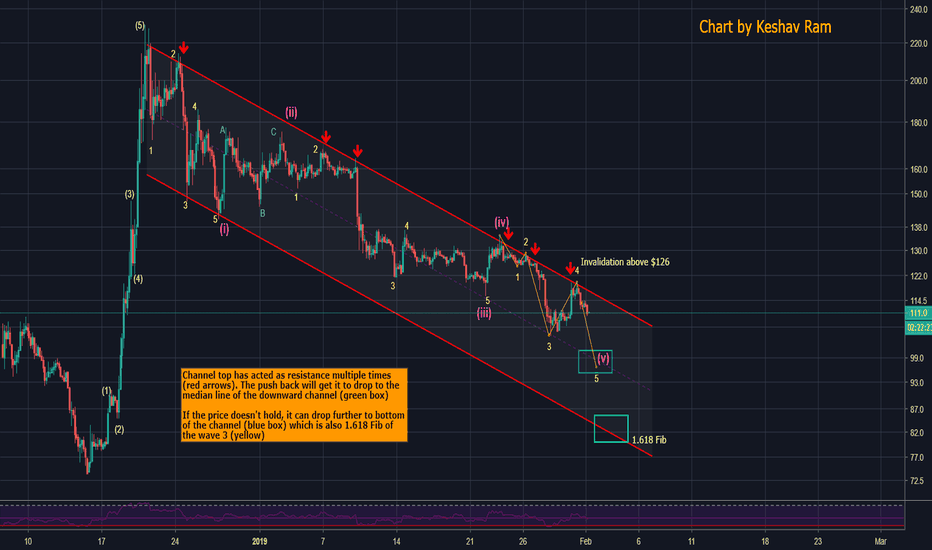
This looks like a no-go. I closed my longs. I'm considering that ABC waves are done (blue) and we are in a 1-5 waves down, also the yesterday's bounce was till 0.618 Fib of yellow wave 1Short Entry below 119-117 with stop loss@$126+
Another major reason I'm uncertain about longs is today's post on BTC

Note
Based on the discussion with Boon2 on the above BTC thread, this can be considered as a long because BTC is painting a bull flag.Our previous stop target was also not hit, so the downside at the current price if $121 is also limited
Additionally, we seem to be in an ABCDE consolidation triangle which just broke out, I also like that 4H 50 EMA is acting as support (orange). We have a tight stop loss and another one at 117 which invalidates this bullish count and consideres that we are still in correction
Note
Zoomed in another countNote
Safer trade can also be to wait for a daily candle to breakout of this downward channel as recent attempts have failed. Note the 50 Day EMA (orange)Note
Our first stop loss was hit at $119 and BTC looks weak (see my latest post). I closed my longs and plan to re-enter above $125Take Care
Note
Nice. Our second stop loss did not get his, instead we broke out of the triangle and now facing resistance at 50 Day MA ($130), if we can stay above $124, next resistance would be the red box.Here is the possible count. All the best
Trade closed: target reached
Target Hit. Lets see where we go from hereFollow me for more updates
twitter.com/imkeshav
youtube.com/channel/UCskbBdZstBUQ_4y2o912zzw
twitter.com/imkeshav
youtube.com/channel/UCskbBdZstBUQ_4y2o912zzw
Related publications
Disclaimer
The information and publications are not meant to be, and do not constitute, financial, investment, trading, or other types of advice or recommendations supplied or endorsed by TradingView. Read more in the Terms of Use.
Follow me for more updates
twitter.com/imkeshav
youtube.com/channel/UCskbBdZstBUQ_4y2o912zzw
twitter.com/imkeshav
youtube.com/channel/UCskbBdZstBUQ_4y2o912zzw
Related publications
Disclaimer
The information and publications are not meant to be, and do not constitute, financial, investment, trading, or other types of advice or recommendations supplied or endorsed by TradingView. Read more in the Terms of Use.