Technical Pattern Observed:
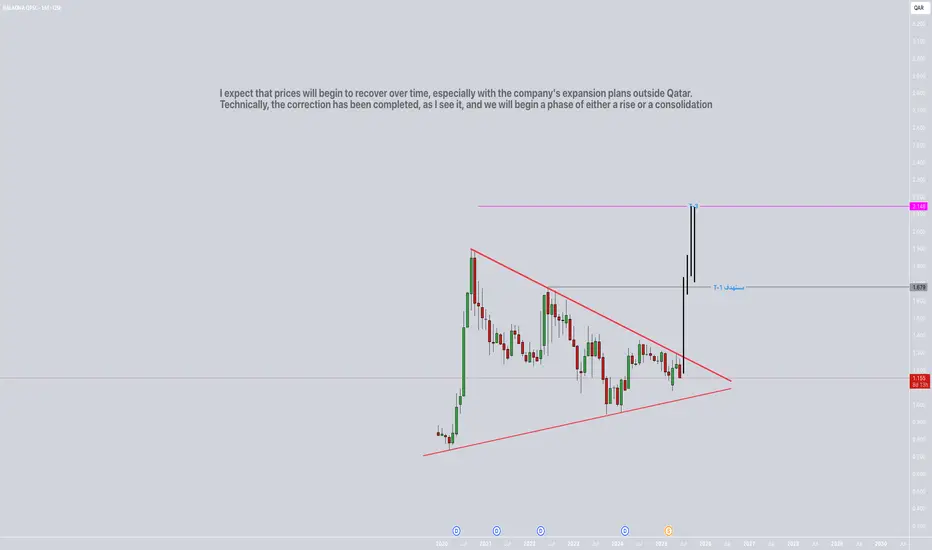
The chart shows a Symmetrical Triangle pattern that has formed since around 2021.
The price has recently broken out of the triangle to the upside, which is typically seen as a bullish signal indicating a potential trend reversal or continuation.
📈 Projection Targets:
Target 1 (T-1): QAR 1.679
Target 3 (T-3): QAR 2.148
These targets are derived by projecting the height of the triangle from the breakout point upwards.
📊 Analyst Commentary (from chart text):
"I expect that prices will begin to recover over time, especially with the company's expansion plans outside Qatar. Technically, the correction has been completed, as I see it, and we will begin a phase of either a rise or a consolidation."
This supports a bullish outlook for Baladna, assuming the breakout holds and the broader market conditions are favorable.
✅ Implications for Investors:
Medium to Long-Term Investors: This breakout could be a signal to consider entry, especially if price action confirms the breakout with increased volume.
Suggested Technical Stop-Loss: Below the lower boundary of the triangle (around QAR 1.10), in case of a false breakout.
Disclaimer
The information and publications are not meant to be, and do not constitute, financial, investment, trading, or other types of advice or recommendations supplied or endorsed by TradingView. Read more in the Terms of Use.
Disclaimer
The information and publications are not meant to be, and do not constitute, financial, investment, trading, or other types of advice or recommendations supplied or endorsed by TradingView. Read more in the Terms of Use.