Trend lines - Bitcoin still respecting the Monthly curve trendline . Sitting above support of Weekly up trendline . Currently we have reclaimed 1 weekly downtrend resistance trend line . We could see a retest and launch back upto around 8000.
Ichimoku - One of the more bearish indicators at the moment. Currently under the kumo which is bearish . We could fall back to around 6900. We have 2 - 3 months to break above the kumo cloud which would be very bullish . The resistance of the bottom of Kumo cloud is perfectcly horizontal. This can be stronger resistance to break through.
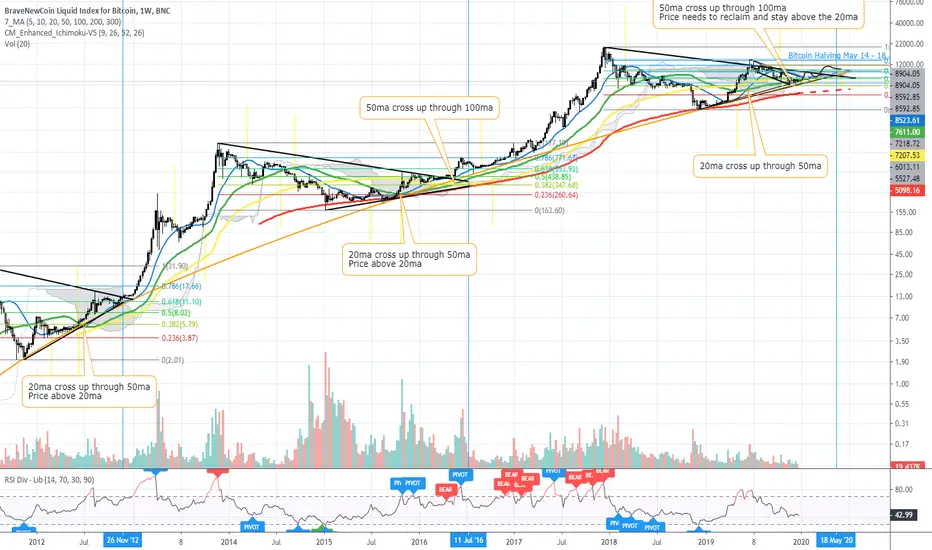
MA's - As per callouts on chart, we have 50ma/100ma goldencross 3 weeks ago. MA's are now as per previous halving, althought price needs to reclaim and stay above the 50ma and 20ma. If we don't get above the 20ma this idea may be invalidated.
Fibs - The 2 previous halving's both had price roughly half way between the 0.618 and 0.786 Fib levels at time of halving. If we repeat this we could see price around $11200 although the range betwen the fibs is larger at $9800 - $13342
RSI - Currently in middle of range in downtrend. Somewhat similar to previous halving's although not much useful information.
Volume - Volume in downtrend similar to previous.
OB's - Currently sitting on Weekly order block as strong support along with HTF trendlines . Will need to reclaim weekly and monthly OB to play out.
Pivots - Near end of current HTF pivots . No new pivots printed yet. No useful information yet.
CME Gaps - Gap at 11695 - 11910 still yet to be filled. If we get some bullish momentum we could carry on and fill this gap.
Patterns - Possibly forming half of an Inverse H&S at the moment on weekly chart. The daily chart is also forming a smaller Inverse H&S that if plays out would help form the head of the weekly pattern. We could come back down to the 6900 area to complete this. If Inv . H&S palys out this should print a Broadening Descending Wedge pattern, which is another bullish pattern .
Conclusion - Based on previous halving's we could see price at time of halving between $10161 and $11545. My best estimate would be sitting above monthly OB at around the $10400 area. Price is currently under the kumo and the 20ma and 50ma, this could invalidate this idea. If we can get back above all 3 of these i will turn much more bullish .
*This is just 1 idea that could play out. It may not play out at all and it could easily play out differently.
Ichimoku - One of the more bearish indicators at the moment. Currently under the kumo which is bearish . We could fall back to around 6900. We have 2 - 3 months to break above the kumo cloud which would be very bullish . The resistance of the bottom of Kumo cloud is perfectcly horizontal. This can be stronger resistance to break through.
MA's - As per callouts on chart, we have 50ma/100ma goldencross 3 weeks ago. MA's are now as per previous halving, althought price needs to reclaim and stay above the 50ma and 20ma. If we don't get above the 20ma this idea may be invalidated.
Fibs - The 2 previous halving's both had price roughly half way between the 0.618 and 0.786 Fib levels at time of halving. If we repeat this we could see price around $11200 although the range betwen the fibs is larger at $9800 - $13342
RSI - Currently in middle of range in downtrend. Somewhat similar to previous halving's although not much useful information.
Volume - Volume in downtrend similar to previous.
OB's - Currently sitting on Weekly order block as strong support along with HTF trendlines . Will need to reclaim weekly and monthly OB to play out.
Pivots - Near end of current HTF pivots . No new pivots printed yet. No useful information yet.
CME Gaps - Gap at 11695 - 11910 still yet to be filled. If we get some bullish momentum we could carry on and fill this gap.
Patterns - Possibly forming half of an Inverse H&S at the moment on weekly chart. The daily chart is also forming a smaller Inverse H&S that if plays out would help form the head of the weekly pattern. We could come back down to the 6900 area to complete this. If Inv . H&S palys out this should print a Broadening Descending Wedge pattern, which is another bullish pattern .
Conclusion - Based on previous halving's we could see price at time of halving between $10161 and $11545. My best estimate would be sitting above monthly OB at around the $10400 area. Price is currently under the kumo and the 20ma and 50ma, this could invalidate this idea. If we can get back above all 3 of these i will turn much more bullish .
*This is just 1 idea that could play out. It may not play out at all and it could easily play out differently.
Disclaimer
The information and publications are not meant to be, and do not constitute, financial, investment, trading, or other types of advice or recommendations supplied or endorsed by TradingView. Read more in the Terms of Use.
Disclaimer
The information and publications are not meant to be, and do not constitute, financial, investment, trading, or other types of advice or recommendations supplied or endorsed by TradingView. Read more in the Terms of Use.