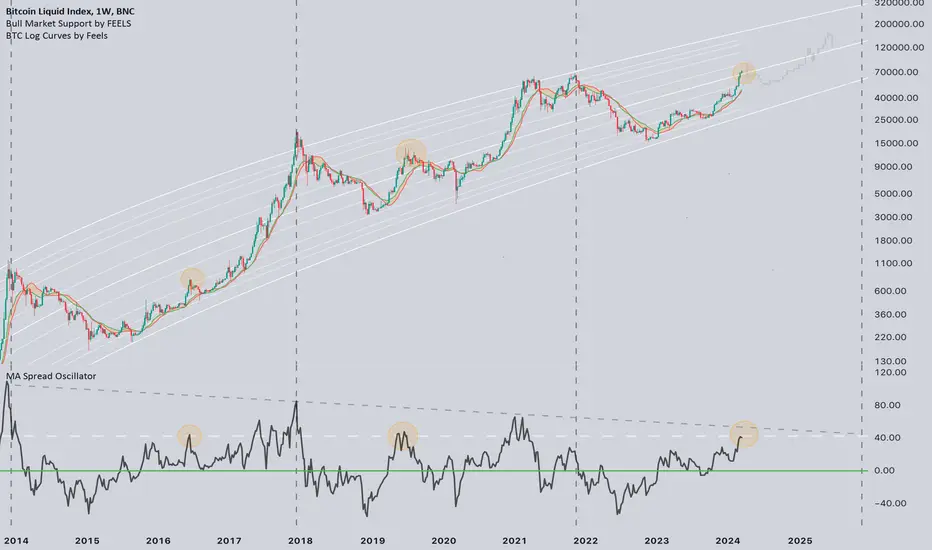
#Bitcoin distance from BMS
Below is the oscillator, which shows how far the price has moved away from the bull market support. Mostly when we are in the 2-3 year of the cycle, the mark on the oscillator 40 acts as resistance, which indicates a mid-cycle peak.
Can it be different this time?🤔
Let's imagine that the BTC ETF inflow will be greater and distort the situation, in this case, we have a second trend line that indicates a global peak, which, by the way, becomes lower every cycle, now this mark is around ~50 on the oscillator or 80k on the price chart. You can consider this mark a best-case scenario for a local peak.
💡Remember, a good investor does not rely on one scenario but is ready for any.
Below is the oscillator, which shows how far the price has moved away from the bull market support. Mostly when we are in the 2-3 year of the cycle, the mark on the oscillator 40 acts as resistance, which indicates a mid-cycle peak.
Can it be different this time?🤔
Let's imagine that the
💡Remember, a good investor does not rely on one scenario but is ready for any.
Note
3 months ago I predicted a local peak, although at the time my thoughts were not supported by many.
🗣As I said, zone 40 on the oscillator acted as resistance. And we haven't received too big liquidity surges from ETFs (so far).
What's next? Zone ~0 (BMS) on the oscillator, on the contrary, often acts as a support in the correction, especially after halving. I think this time it can also be our strong support if the capitulation of the miners will last.
Regarding the long-term forecasts, everything remains quite positive↗️
Note
I don't want to start the post with the phrase, "It happened as I said," but I really warned and drew a fractal.
📝As you can see, we tested the BMS (zone 0 on the oscillator). Is this a local bottom? It seems so.
🤔Could we see another move lower as the summer season has just begun? Yes, but the probability is not high and the strength of this movement, I think, will not be great.
💡What's next? Now only up? I believe that we will spend some time in this range of 56-72k. Exit from this range, as I wrote earlier, closer to autumn↗️
Note
📝When we were at 72k, I posted a scenario with a correction with a downtrend in the next few months. Now this scenario is still relevant.🤔If there are no new unforeseen situations, such as the cracking of some sector of the economy, and we live to see the previous rate cuts and quantitative easing (QE) this autumn, this scenario will play out in full. I still think of it as a base scenario.
Trade active
📝Last time I predicted a local peak quite accurately. As well as the term of our consolidation.
🤔So, how far are we from the global peak? In terms of distance from BMS, we are only at the 30 mark on the oscillator, although the last local peak in March was at 40.
💡I think we still have some room for movement, but of course, if we continue to grow too fast, we should expect a correction.
💰Also, do not forget to partially fix the profit, because in the inter-cycle vision, we are already closer to the end of the cycle.
Trade closed: target reached
In previous cycles,
📝 Right now, we’re still moving steadily in the mid-zone, not yet overheated, but starting to lean toward that upper area again.
📍The MA Spread Oscillator shows signs of rising momentum, but we’re still far from the levels where previous macro tops formed.
💡This indicates we still have room for upside, especially if momentum builds gradually. However, overall, we are approaching a crucial phase in the market, where we need to prepare for profit-taking in BTC and watch which altcoins show movement.
💰Free Channel t.me/FeelsStrategy
🤵For more info contact t.me/VolodymyrFeels
🤵For more info contact t.me/VolodymyrFeels
Disclaimer
The information and publications are not meant to be, and do not constitute, financial, investment, trading, or other types of advice or recommendations supplied or endorsed by TradingView. Read more in the Terms of Use.
