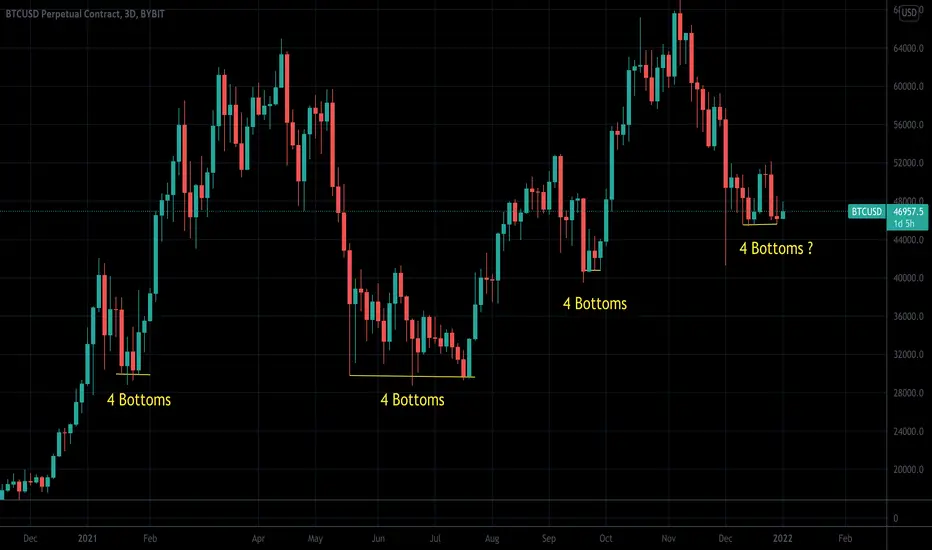
Interestingly if we look at the 3 day chart for Bitcoin we see that every major bottom in 2021 had FOUR 3 day candles that hit the bottom.
We now also have FOUR 3 day candles reaching the same bottom level of approx 45,400 USD.
Could be signalling the bottom of this current downward cycle?
We now also have FOUR 3 day candles reaching the same bottom level of approx 45,400 USD.
Could be signalling the bottom of this current downward cycle?
Disclaimer
The information and publications are not meant to be, and do not constitute, financial, investment, trading, or other types of advice or recommendations supplied or endorsed by TradingView. Read more in the Terms of Use.
Disclaimer
The information and publications are not meant to be, and do not constitute, financial, investment, trading, or other types of advice or recommendations supplied or endorsed by TradingView. Read more in the Terms of Use.