Hello
It's a Bitcoinguide.
If you have a "follower"
You can receive comment notifications on real-time travel routes and major sections.
If my analysis is helpful,
Please would like one booster button at the bottom.

This is the Nasdaq 30-minute chart.
There is an indicator announcement at 10:35,
The Bollinger Band 12-hour chart is touching the resistance line,
But it has not reached the center line of the daily chart.
A gap section is created at the bottom.
The blue finger is a short->long switching strategy,
And I just applied it to Bitcoin.

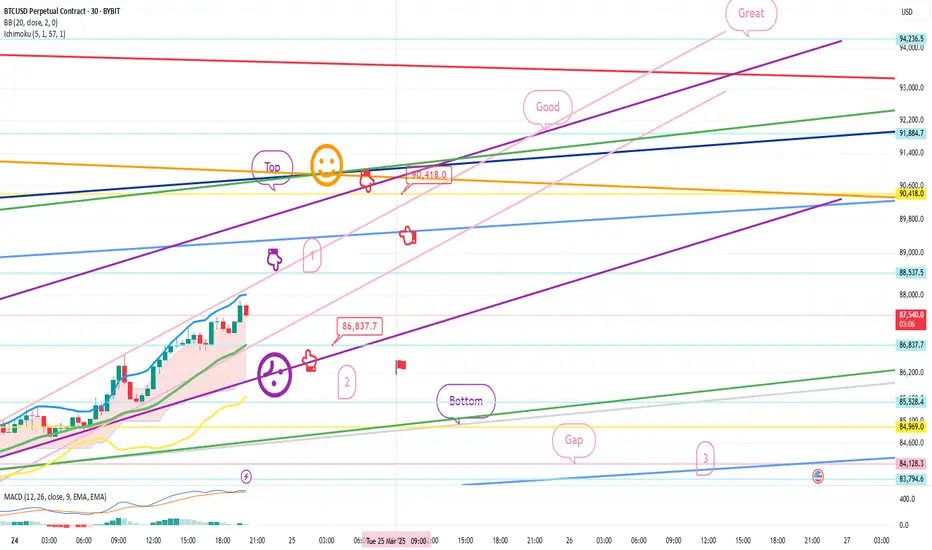
Bitcoin 30-minute chart.
*Red finger movement path
Long position strategy
1. $86,837.7 long position entry section / stop loss price when purple support line is broken
2. $90,418 long position 1st target -> Good 2nd target
The 1st section at the top
is the rising wave section for today's strategy to succeed
(Section for utilizing autonomous short section)
From the 1st section touch
The probability of the strategy succeeding increases.
Refer to Nasdaq movement.
The 2nd section at the bottom seems to be around 1+4 sections
The mid-term pattern is broken from the bottom touch.
After that, the possibility of the bottom gap reversal increases, so please note
Today, since it's been a while, I'll leave it as public
and go in.
Up to this point, I ask that you use my analysis as a reference only
I hope that you operate safely with principle trading and stop loss prices.
Thank you.
It's a Bitcoinguide.
If you have a "follower"
You can receive comment notifications on real-time travel routes and major sections.
If my analysis is helpful,
Please would like one booster button at the bottom.
This is the Nasdaq 30-minute chart.
There is an indicator announcement at 10:35,
The Bollinger Band 12-hour chart is touching the resistance line,
But it has not reached the center line of the daily chart.
A gap section is created at the bottom.
The blue finger is a short->long switching strategy,
And I just applied it to Bitcoin.
Bitcoin 30-minute chart.
*Red finger movement path
Long position strategy
1. $86,837.7 long position entry section / stop loss price when purple support line is broken
2. $90,418 long position 1st target -> Good 2nd target
The 1st section at the top
is the rising wave section for today's strategy to succeed
(Section for utilizing autonomous short section)
From the 1st section touch
The probability of the strategy succeeding increases.
Refer to Nasdaq movement.
The 2nd section at the bottom seems to be around 1+4 sections
The mid-term pattern is broken from the bottom touch.
After that, the possibility of the bottom gap reversal increases, so please note
Today, since it's been a while, I'll leave it as public
and go in.
Up to this point, I ask that you use my analysis as a reference only
I hope that you operate safely with principle trading and stop loss prices.
Thank you.
Trade active
HelloIt's a Bitcoin Guide.
I will check the movement after writing the analysis article on March 24th.
This is the Nasdaq 30-minute chart.
The main sections are marked with black fingers.
The sky blue finger short->long switching strategy was used,
But it ended with an upward sideways movement from the first section to Gap4.
The distance from the Gap section at the bottom has increased.
This is the Bitcoin 30-minute chart.
The main sections are marked with black fingers.
In the red finger long position strategy,
It started with an autonomous short of 88,537.5 dollars in the first section with the purple finger at the top
And ended with a downward sideways movement.
After the additional daily candle was created today,
After detouring and entering a long position at the red finger 86,637.7 dollars,
It is moving sideways.
Because the candle is created to the right while moving sideways,
It is difficult to judge that the purple support line has been broken,
The strategy is active processing.
As indicated, it has fallen to about 1,700 dollars and is rebounding.
Please refer to the main sections I left and operate well.
The participation rate has dropped a lot, so I will proceed privately today.
Thank you.
Note
HelloIt's a Bitcoin Guide.
I will check the movement after writing the analysis article on March 25th.
This is the Nasdaq 30-minute chart.
The main sections are marked with black fingers.
In the red finger long position strategy,
Upper wave 1st section -> Lower red finger 20143.3
Long position entry section without touching
Finished extreme sideways.
First touched the lower Bollinger band
and is breaking away from the purple support line.
This is the Bitcoin 30-minute chart.
The main sections are marked with black fingers.
In the analysis article on the 24th on the lower left,
I connected the strategy after entering the long position at $86837.7. In the blue finger short->long switching strategy,
After touching the short position switching section at the top of 88,097.2 dollars, it is moving sideways in a downward direction.
(Long position profit-taking completed)
Without touching the long position switching section at the bottom of 86,854.5 dollars,
It is moving sideways.
Uninteresting movements are continuing due to the influence of Nasdaq,
And yesterday, the dangerous signal,
The 4-hour chart MACD dead cross, has been imprinted.
Today, it has touched the short position entry section.
I will connect the analysis articles from the 24th and 25th to
today's strategy.
The strategy is active.
I will continue as is.
Today, I will proceed with a short and thick full disclosure.
Thank you.
*비트코인가이드 공식텔레그램 Telegram
t.me/BTG_Group
*빙엑스 BingX 50%DC+$5,000 (총1회수수료)
bingx.com/invite/YBM3A4
*바이비트 Bybit 20%DC+$5,020
partner.bybit.com/b/Bitcoin_Guide
*제로마켓 ZeroMarket ECN계좌 40%DC (해외선물,FX)
bit.ly/3pY0dUv
t.me/BTG_Group
*빙엑스 BingX 50%DC+$5,000 (총1회수수료)
bingx.com/invite/YBM3A4
*바이비트 Bybit 20%DC+$5,020
partner.bybit.com/b/Bitcoin_Guide
*제로마켓 ZeroMarket ECN계좌 40%DC (해외선물,FX)
bit.ly/3pY0dUv
Related publications
Disclaimer
The information and publications are not meant to be, and do not constitute, financial, investment, trading, or other types of advice or recommendations supplied or endorsed by TradingView. Read more in the Terms of Use.