📉 BTC/USD Analysis – 4H Chart Breakdown
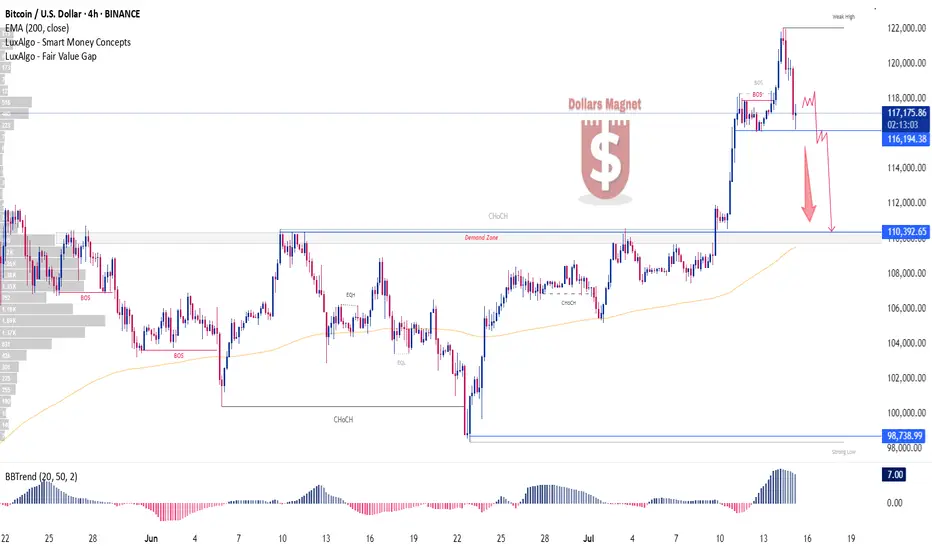
Bitcoin is currently showing signs of a potential reversal after forming a weak high near the $122,000 mark. Price has dropped back below the recent break of structure (BOS) and is hovering around the $117,000 zone.
A rejection at this level could trigger a deeper retracement toward the key support zone around $116,194, and possibly further to the demand zone near $110,392.
The chart also shows a clear change of character (CHoCH) and a strong BOS, indicating that the bullish momentum may be losing steam in the short term. If price breaks below $116K, it could confirm bearish intent toward the lower imbalance zones.
💡 Watching how price reacts at $116K is critical. A break below may open the path toward $110K and even $98K (strong low) if bearish pressure intensifies.
🚨 Not financial advice. Trade wisely with proper risk management.
💬 Like, comment & follow for more high-quality Smart Money-based analysis!
📊 #Bitcoin #BTCUSD #SmartMoneyConcepts #CryptoAnalysis #TradingView
💲𝗙𝗢𝗥𝗘𝗫 < 𝗚𝗢𝗟𝗗 > ₿ 𝗕𝗧𝗖 || Real Trades, Real Results 🧿 || 🚨 VIP Signals {My Personal Entries} 🔗Join Telegram – Trade smarter. t.me/DollarsMagnet1
Premium Channel For Gold Trading.
t.me/iTradeDollar
Premium Channel For Gold Trading.
t.me/iTradeDollar
Related publications
Disclaimer
The information and publications are not meant to be, and do not constitute, financial, investment, trading, or other types of advice or recommendations supplied or endorsed by TradingView. Read more in the Terms of Use.