Explain
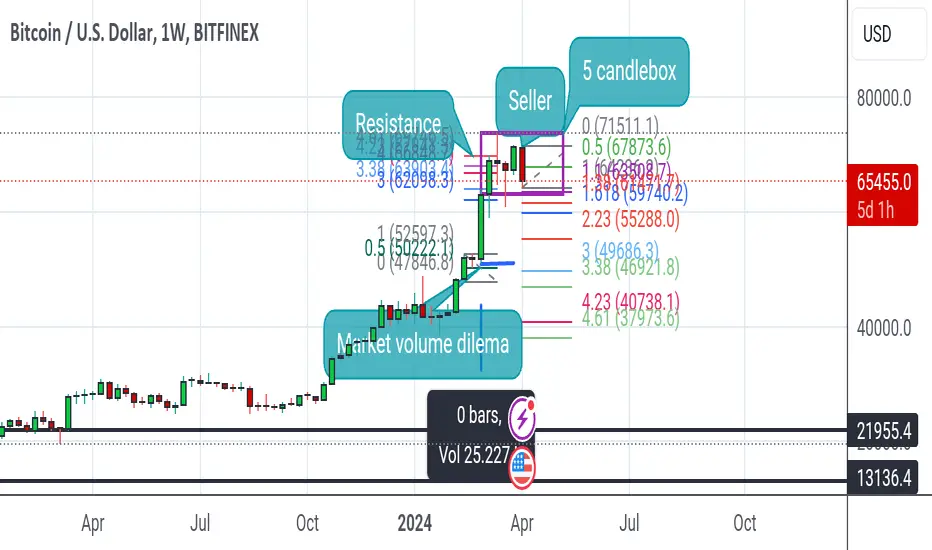
Chart has reached a resistance zone and shows sellers power to reverse the market. Since it stopped with some bearish candle, it proves the intention of reverse. And here is another proof; while buyers where pushing up, they let a big volume candlestick behind making it an opening to bring market to make a correction toward 51k~47.6k. Market returns to candlesticks with high volume, and, in this case, this one haven't been touched. Between well known reverse patterns, I choose the Elliot Wave, formed by five candlesticks that finishes with a bearish candle. Once breaks support [marked with the box], it should make a retest and finish correction. Since momentum is still bullish, it won't go deeper. It will bounce back to maybe double top or higher (unofficial).
Chart has reached a resistance zone and shows sellers power to reverse the market. Since it stopped with some bearish candle, it proves the intention of reverse. And here is another proof; while buyers where pushing up, they let a big volume candlestick behind making it an opening to bring market to make a correction toward 51k~47.6k. Market returns to candlesticks with high volume, and, in this case, this one haven't been touched. Between well known reverse patterns, I choose the Elliot Wave, formed by five candlesticks that finishes with a bearish candle. Once breaks support [marked with the box], it should make a retest and finish correction. Since momentum is still bullish, it won't go deeper. It will bounce back to maybe double top or higher (unofficial).
Disclaimer
The information and publications are not meant to be, and do not constitute, financial, investment, trading, or other types of advice or recommendations supplied or endorsed by TradingView. Read more in the Terms of Use.
Disclaimer
The information and publications are not meant to be, and do not constitute, financial, investment, trading, or other types of advice or recommendations supplied or endorsed by TradingView. Read more in the Terms of Use.