*****Please note*****
I am as bullish as one can be on BTC over the long term (year+). When referring to the short term, I really mean a period of about 3-6 weeks. This is my first attempt at using indicators to analyze charts.
*************
My fundamental trading principals are to use the MACD as my default trend indicator. Once I see a move across the long term moving average I begin a three day countdown. This allows me time to gain more confidence about whether I think the current trend has substantive merit. If I believe its merit (price has continued to diverge/converge after three 3 days), I then wait until the RSI and CCI confirm my beliefs about the trend i.e. RSI shows overbought signal and/or downward trend off recent overbought signal AND the CCI shows at least a downward trend (but more preferably I would like to see it cross below that 0 barrier). Only once all three indicators are in alignment will I execute a trade.
Below are the steps I've taken which led me to conclude that a SHORT SALE of BTC on September 5th, 2017 would have been a prime SELL opportunity. I will follow my reasoning with a description of when I would have last bought BTC using these same principals. This will show my theoretical profit had I followed these trading principals in real time.
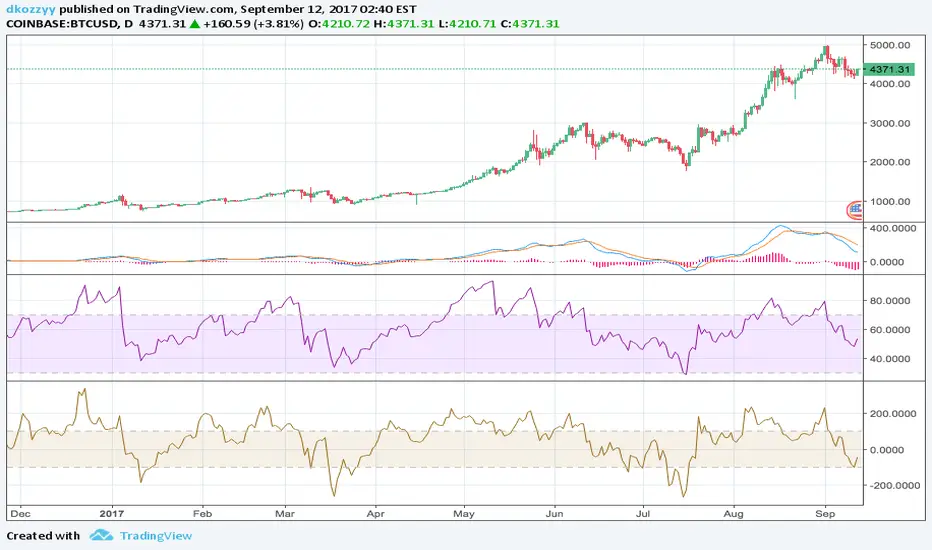
Open the BTC chart under 1D view. Zoom out to view the last year.
Add the MACD, RSI and CCI indicators.
Using MACD, you can see that the short term moving average crossed below the long term moving average on 9/2/17 ~ this triggers the 3 day countoff and what I will be looking for is a further divergence of the STMA from the LTMA thus indicating that the price of BTC/USD would diminish over the short term.
9/5/17 - We can see that the price continued to diverge over the following 3 days which gave merit to my belief that the price will trend downward. However, to really be sold on this trend, I want to see an overbought signal from the RSI and at least downward trending CCI.
9/5/17 - RSI is showing a downward trend since 9/2/17 when we experienced an overbought signal. You should note this was the same day that the MACD indicted that BTC price trend may be headed downward.
9/5/17 - CCI is showing a downward trend. This is another affirmation that the price is headed down. If we want to be extra, extra safe, we could wait until CCI crosses below the 0 barrier. In fact, only three days later we see that the CCI does cross the 0 barrier and we can add yet another "pass" to our fundamental criteria.
9/8/17 - All three criteria have been fully met. We sell our BTC for $4500 USD when the CCI finally crosses 0 barrier.
Below, I will search back for a move above the LTMA where these criteria were met and this will represent the most recent, suitable entry point.
7/19/17 - Short Term moving average crosses above the LTMA. Belief is that price may begin a trend upward. 3 day countoff begins.
7/22/17 - The STMA has continued to diverge from the LTMA thus confirming my belief has merit. I then want to look at RSI and CCI.
7/22/17 - We can see RSI nearly reached an oversold signal and began a trend upward. This is confirming we may want to buy. Further, CCI is above the 0 barrier and has been since the 19th, the same day we had the STMA move across the LTMA. All of this confirms for me that this represented a buy opportunity.
7/22/17 - We would have bought BTC on this day for approximately $2250 USD.
Conclusion
If we had followed these principals to a T we would have entered the market on 7/22/17 at $2250/BTC. We would have exited on 9/7/17 at $4500/BTC, making 100% return in just under 2 months. I invite critique to my analysis and presentation style.
I also invite you to continue to reach back into Bitcoins history to locate further examples of where this analysis holds true. Other moving average dates I encourage you to view are 3/30/17 Buy/Entry Opportunity and 6/19/17 - Sell/Exit Opportunity.
I am as bullish as one can be on BTC over the long term (year+). When referring to the short term, I really mean a period of about 3-6 weeks. This is my first attempt at using indicators to analyze charts.
*************
My fundamental trading principals are to use the MACD as my default trend indicator. Once I see a move across the long term moving average I begin a three day countdown. This allows me time to gain more confidence about whether I think the current trend has substantive merit. If I believe its merit (price has continued to diverge/converge after three 3 days), I then wait until the RSI and CCI confirm my beliefs about the trend i.e. RSI shows overbought signal and/or downward trend off recent overbought signal AND the CCI shows at least a downward trend (but more preferably I would like to see it cross below that 0 barrier). Only once all three indicators are in alignment will I execute a trade.
Below are the steps I've taken which led me to conclude that a SHORT SALE of BTC on September 5th, 2017 would have been a prime SELL opportunity. I will follow my reasoning with a description of when I would have last bought BTC using these same principals. This will show my theoretical profit had I followed these trading principals in real time.
Open the BTC chart under 1D view. Zoom out to view the last year.
Add the MACD, RSI and CCI indicators.
Using MACD, you can see that the short term moving average crossed below the long term moving average on 9/2/17 ~ this triggers the 3 day countoff and what I will be looking for is a further divergence of the STMA from the LTMA thus indicating that the price of BTC/USD would diminish over the short term.
9/5/17 - We can see that the price continued to diverge over the following 3 days which gave merit to my belief that the price will trend downward. However, to really be sold on this trend, I want to see an overbought signal from the RSI and at least downward trending CCI.
9/5/17 - RSI is showing a downward trend since 9/2/17 when we experienced an overbought signal. You should note this was the same day that the MACD indicted that BTC price trend may be headed downward.
9/5/17 - CCI is showing a downward trend. This is another affirmation that the price is headed down. If we want to be extra, extra safe, we could wait until CCI crosses below the 0 barrier. In fact, only three days later we see that the CCI does cross the 0 barrier and we can add yet another "pass" to our fundamental criteria.
9/8/17 - All three criteria have been fully met. We sell our BTC for $4500 USD when the CCI finally crosses 0 barrier.
Below, I will search back for a move above the LTMA where these criteria were met and this will represent the most recent, suitable entry point.
7/19/17 - Short Term moving average crosses above the LTMA. Belief is that price may begin a trend upward. 3 day countoff begins.
7/22/17 - The STMA has continued to diverge from the LTMA thus confirming my belief has merit. I then want to look at RSI and CCI.
7/22/17 - We can see RSI nearly reached an oversold signal and began a trend upward. This is confirming we may want to buy. Further, CCI is above the 0 barrier and has been since the 19th, the same day we had the STMA move across the LTMA. All of this confirms for me that this represented a buy opportunity.
7/22/17 - We would have bought BTC on this day for approximately $2250 USD.
Conclusion
If we had followed these principals to a T we would have entered the market on 7/22/17 at $2250/BTC. We would have exited on 9/7/17 at $4500/BTC, making 100% return in just under 2 months. I invite critique to my analysis and presentation style.
I also invite you to continue to reach back into Bitcoins history to locate further examples of where this analysis holds true. Other moving average dates I encourage you to view are 3/30/17 Buy/Entry Opportunity and 6/19/17 - Sell/Exit Opportunity.
Disclaimer
The information and publications are not meant to be, and do not constitute, financial, investment, trading, or other types of advice or recommendations supplied or endorsed by TradingView. Read more in the Terms of Use.
Disclaimer
The information and publications are not meant to be, and do not constitute, financial, investment, trading, or other types of advice or recommendations supplied or endorsed by TradingView. Read more in the Terms of Use.