📊 BTCUSD Market Analysis & Trade Outlook (Post $103,500 Target)
Instrument: BTCUSD
Strategy Type: Probabilistic Breakout with Elliott & Gann Confluence
Current Price: $102,600
Trade Horizon: 2–5 Days
Timeframes Observed: 4H / Daily
🔍 Market Overview
BTCUSD has successfully completed the prior trend continuation target of $103,500, respecting the bullish structure on 4H and Daily timeframes.

As of now, price is consolidating just below key resistance, printing a high of $103,800 and retracing slightly to $102,600. This signals a potential decision zone where BTC may either continue its advance or initiate a deeper pullback.
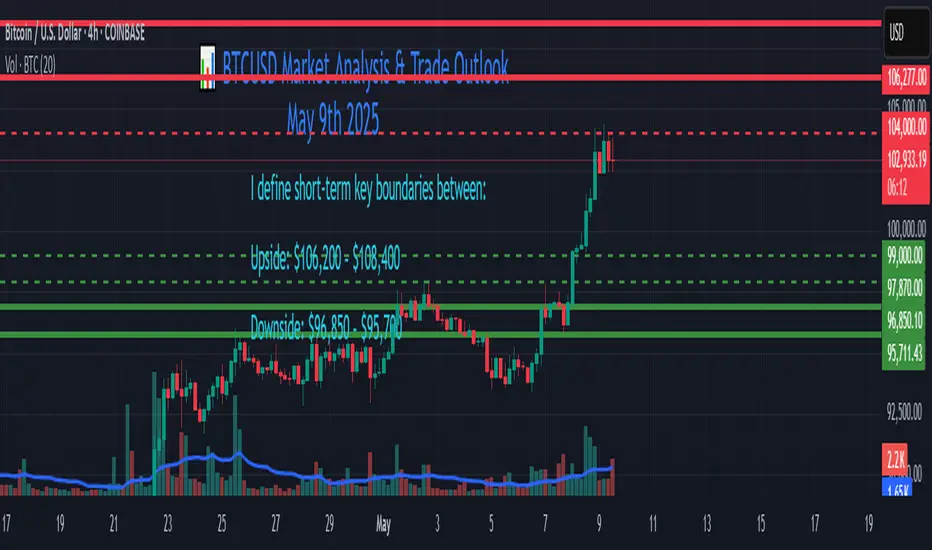
I define short-term key boundaries between:
Upside: $106,200 – $108,400
Downside: $96,850 – $95,700
📐 Technical Structure & Key Zones
Support Zone: $ 97870 , $96,850–$95,700 (Previous consolidation + high volume node)
Resistance Zone: $106,200–$108,400 (Measured move & fib cluster area)
Structure Bias: Bullish above $99,000; bearish pressure increases below $96,850
🔄 Elliott Wave Count (Short-Term, 4H)
BTC appears to be in a Wave (3) of a higher-degree Wave 3, following a Wave (2) retracement toward $94,500.
Current price movement is within a sub-wave 3 of (3), with the recent high at $103,800 potentially marking a sub-wave 3 top.
A brief corrective Wave 4 could develop toward $100,500–$99,000, before a final Wave 5 drives price into the $106,200–$108,400 zone.
If price fails to hold above $96,850, the structure may morph into a larger corrective Wave (4), targeting the lower boundary.
📊 Gann Analysis
The Gann 1/1 angle from the March swing low is currently intersecting near $102,500–$103,000, offering resistance.
Next key Gann levels:
Above: $106,200 (120°) and $108,400 (135°) resistance arcs
Below: $96,850 and $95,700 align with 45° and 60° support angles
Timewise, entering a minor Gann cycle window on May 10–11, often associated with inflection points. Watch for breakout or reversal signals near this period.
🎯 Trade Scenario Outlook
🟢 Bullish Scenario (Breakout)
Trigger: 4H close above $104,000
Target Zones:
TP1: $106,200
TP2: $108,400
Invalidation: 4H close below $99,000 (consider tightening SL)
🔴 Bearish Scenario (Pullback)
Trigger: Break below $99,000, especially on strong volume
Target Zones:
TP1: $97870 or $96,850
TP2: $95,700
Invalidation: Close above $104,000 invalidates pullback thesis
⚙️ Strategic Trade Notes
Scalping & Swinging Options:
Consider range scalps within $102,000–$99,000, but prepare for trend breakout.
Swing traders may build positions on retracement (Wave 4) with invalidation below $97870, $96,850.
Risk Management:
Use volatility-adjusted stop losses under key Gann levels or 50EMA on 4H.
Consider tightening stops or taking partials near $106,200 to protect gains if price extends.
📌 Conclusion
BTCUSD remains in a bullish macro structure but approaches a key inflection zone. A break and hold above $104,000 could launch the next impulsive leg toward $108,400. Conversely, failure to hold above $99,000 opens the door for a deeper retracement to $ 97870, $96,850–$95,700. Traders should remain flexible, aligning with the prevailing momentum while respecting structural boundaries.
Instrument: BTCUSD
Strategy Type: Probabilistic Breakout with Elliott & Gann Confluence
Current Price: $102,600
Trade Horizon: 2–5 Days
Timeframes Observed: 4H / Daily
🔍 Market Overview
BTCUSD has successfully completed the prior trend continuation target of $103,500, respecting the bullish structure on 4H and Daily timeframes.
As of now, price is consolidating just below key resistance, printing a high of $103,800 and retracing slightly to $102,600. This signals a potential decision zone where BTC may either continue its advance or initiate a deeper pullback.
I define short-term key boundaries between:
Upside: $106,200 – $108,400
Downside: $96,850 – $95,700
📐 Technical Structure & Key Zones
Support Zone: $ 97870 , $96,850–$95,700 (Previous consolidation + high volume node)
Resistance Zone: $106,200–$108,400 (Measured move & fib cluster area)
Structure Bias: Bullish above $99,000; bearish pressure increases below $96,850
🔄 Elliott Wave Count (Short-Term, 4H)
BTC appears to be in a Wave (3) of a higher-degree Wave 3, following a Wave (2) retracement toward $94,500.
Current price movement is within a sub-wave 3 of (3), with the recent high at $103,800 potentially marking a sub-wave 3 top.
A brief corrective Wave 4 could develop toward $100,500–$99,000, before a final Wave 5 drives price into the $106,200–$108,400 zone.
If price fails to hold above $96,850, the structure may morph into a larger corrective Wave (4), targeting the lower boundary.
📊 Gann Analysis
The Gann 1/1 angle from the March swing low is currently intersecting near $102,500–$103,000, offering resistance.
Next key Gann levels:
Above: $106,200 (120°) and $108,400 (135°) resistance arcs
Below: $96,850 and $95,700 align with 45° and 60° support angles
Timewise, entering a minor Gann cycle window on May 10–11, often associated with inflection points. Watch for breakout or reversal signals near this period.
🎯 Trade Scenario Outlook
🟢 Bullish Scenario (Breakout)
Trigger: 4H close above $104,000
Target Zones:
TP1: $106,200
TP2: $108,400
Invalidation: 4H close below $99,000 (consider tightening SL)
🔴 Bearish Scenario (Pullback)
Trigger: Break below $99,000, especially on strong volume
Target Zones:
TP1: $97870 or $96,850
TP2: $95,700
Invalidation: Close above $104,000 invalidates pullback thesis
⚙️ Strategic Trade Notes
Scalping & Swinging Options:
Consider range scalps within $102,000–$99,000, but prepare for trend breakout.
Swing traders may build positions on retracement (Wave 4) with invalidation below $97870, $96,850.
Risk Management:
Use volatility-adjusted stop losses under key Gann levels or 50EMA on 4H.
Consider tightening stops or taking partials near $106,200 to protect gains if price extends.
📌 Conclusion
BTCUSD remains in a bullish macro structure but approaches a key inflection zone. A break and hold above $104,000 could launch the next impulsive leg toward $108,400. Conversely, failure to hold above $99,000 opens the door for a deeper retracement to $ 97870, $96,850–$95,700. Traders should remain flexible, aligning with the prevailing momentum while respecting structural boundaries.
Note
Bullish Scenario (Breakout)Trigger: 4H close above $104,000
Target Zones:
TP1: $106,200
TP2: $108,400
Invalidation: 4H close below $99,000 (consider tightening SL)
Trade closed: target reached
Finally 106000 Hit... Target achieved Note
Finally touched $108,400.Disclaimer
The information and publications are not meant to be, and do not constitute, financial, investment, trading, or other types of advice or recommendations supplied or endorsed by TradingView. Read more in the Terms of Use.
Disclaimer
The information and publications are not meant to be, and do not constitute, financial, investment, trading, or other types of advice or recommendations supplied or endorsed by TradingView. Read more in the Terms of Use.