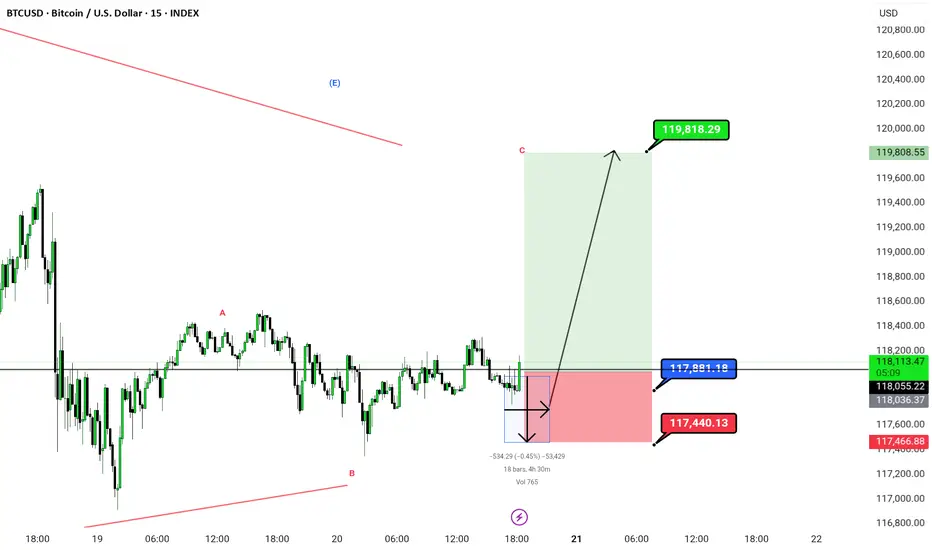
This chart shows a 15-minute timeframe analysis for BTC/USD (Bitcoin/US Dollar) using Elliott Wave .
---
📊 Chart Summary:
Wave Structure:
Labeled with corrective wave A–B–C, indicating the end of a corrective pattern.
Price is currently in the potential reversal zone near Wave B, suggesting a bullish move toward Wave C completion.
---
✅ Trade Setup:
Entry Zone: Around current price levels (≈117,889.74)
Stop Loss (SL): 117,440.13 (marked in red)
Target (TP): 119,818.29 (marked in green)
Risk-to-Reward Ratio (RRR): Approx. 1:4, a favorable trade setup
---
🔍 Key Technical Observations:
Bullish Projection: A large green zone indicating strong bullish momentum if Wave C plays out.
Invalidation Zone: Price falling below 117,440.13 would invalidate the bullish count.
Volume Marker: Small thunderbolt symbol at the bottom could imply a volume spike or a critical event time.
Chart Title: Published under Greenfireforex branding, timestamped Jul 20, 2025, likely indicating a public or private analysis post.
---
📌 Possible Interpretation:
This chart suggests a buy opportunity for BTCUSD if price respects the bottom zone (117,440) and begins to climb toward the projected target (119,818). It uses wave theory logic assuming this is a Wave C rally, and price has completed a corrective move.
I'm ready to answer in comments session
---
📊 Chart Summary:
Wave Structure:
Labeled with corrective wave A–B–C, indicating the end of a corrective pattern.
Price is currently in the potential reversal zone near Wave B, suggesting a bullish move toward Wave C completion.
---
✅ Trade Setup:
Entry Zone: Around current price levels (≈117,889.74)
Stop Loss (SL): 117,440.13 (marked in red)
Target (TP): 119,818.29 (marked in green)
Risk-to-Reward Ratio (RRR): Approx. 1:4, a favorable trade setup
---
🔍 Key Technical Observations:
Bullish Projection: A large green zone indicating strong bullish momentum if Wave C plays out.
Invalidation Zone: Price falling below 117,440.13 would invalidate the bullish count.
Volume Marker: Small thunderbolt symbol at the bottom could imply a volume spike or a critical event time.
Chart Title: Published under Greenfireforex branding, timestamped Jul 20, 2025, likely indicating a public or private analysis post.
---
📌 Possible Interpretation:
This chart suggests a buy opportunity for BTCUSD if price respects the bottom zone (117,440) and begins to climb toward the projected target (119,818). It uses wave theory logic assuming this is a Wave C rally, and price has completed a corrective move.
I'm ready to answer in comments session
Related publications
Disclaimer
The information and publications are not meant to be, and do not constitute, financial, investment, trading, or other types of advice or recommendations supplied or endorsed by TradingView. Read more in the Terms of Use.
Related publications
Disclaimer
The information and publications are not meant to be, and do not constitute, financial, investment, trading, or other types of advice or recommendations supplied or endorsed by TradingView. Read more in the Terms of Use.