⊣
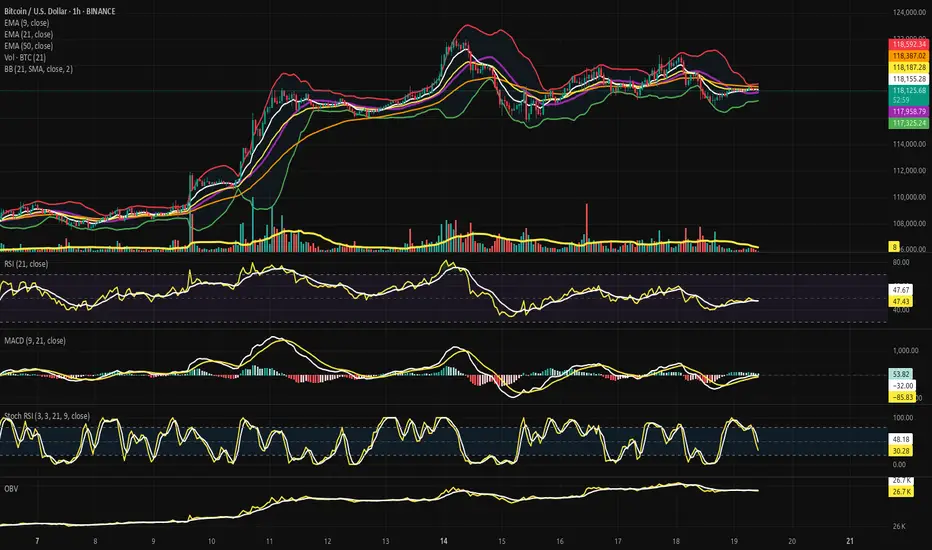
⨀ BTC/USD – BINANCE – (CHART: H1) – (July 19, 2025).
◇ Analysis Price: $118,192.34.
⊣
⨀ I. Temporal Axis - Strategic Interval - (H1):
▦ EMA9 - (Exponential Moving Average - 9 Close):
∴ Price: $118,192.34 | EMA9: $118,176.07;
∴ EMA9 is currently being pierced by price - neither clearly above nor decisively rejected;
∴ The EMA9 has flattened - signaling short-term equilibrium tension, not momentum dominance;
∴ Price candles are compressing into the EMA9 without thrust - indecision at the microstructure.
✴️ Conclusion: Logic sealed - EMA9 reflects tactical stalling; energy coiled at surface level.
⊢
▦ EMA21 - (Exponential Moving Average - 21 Close):
∴ EMA21: $118,199.53 - now above current price, acting as immediate tactical resistance;
∴ A minor bearish slope is forming in EMA21, reflecting recent downside pressure;
∴ Price failed to sustain any candle close above this level in the last 5 sessions - confirming resistance activation.
✴️ Conclusion: Logic sealed - EMA21 has turned from guide to barrier; tactical trend favors compression below.
⊢
▦ EMA50 - (Exponential Moving Average - 50 Close):
∴ EMA50 stands at $118,400.31, well above both price and the shorter EMA's - defining a ceiling of short-term exhaustion;
∴ Its curve is turning sideways, indicating that dominant upward momentum has faded;
∴ The last time price touched EMA50 was during the failed attempt to reclaim the upper Bollinger band - sign of rejection.
✴️ Conclusion: Logic sealed - EMA50 confirms the upper boundary of compression; the short-term trend remains capped.
⊢
▦ Bollinger Bands - (21 SMA, 2 Standard Deviations):
∴ Current BB range:
• Upper Band: $118,586.19;
• Lower Band: $117,291.33;
• Midline - (SMA21): $117,938.76;
∴ Price sits marginally above the midline, but beneath the upper band - indicating a neutral stance within the envelope;
∴ Bands are in a state of mild contraction, reflecting reduced volatility and lack of decisive breakout pressure;
∴ Price has failed to close above the upper band on multiple attempts, suggesting exhaustion without thrust;
✦ Tactical Signal:
• The flattened curvature of the bands and the centering of price near the midline indicates that the market is in compression;
• This condition favors mean-reversion trades or breakout anticipation setups, but lacks directional conviction;
• No squeeze pattern is imminent - but energy is coiling slowly.
✴️ Conclusion: Logic sealed - Bollinger structure is balanced, with compression overtaking directional thrust; breakout not yet awakened.
⊢
▦ Volume + EMA21 - (Tactical Volume Profile H1):
∴ The latest H1 volume candle registers 9 (unit scale), significantly below the average trend of the prior days;
∴ There has been a consistent decline in volume since the spike observed near the $120k rejection zone - participation is fading;
∴ Volume EMA21 is now visibly above most recent volume bars, signaling that market energy has dropped beneath its tactical baseline;
✦ Tactical Diagnosis:
• A market with low volume near compression zones often reflects lack of initiative, not calm;
• The absence of sellers is not strength - it is hesitation;
• The lack of follow-through volume confirms that current price action is drifting, not being driven.
∴ No volume-led breakout is forming - the structure is floating within silence.
✴️ Conclusion: Logic sealed - tactical volume profile confirms stasis; market awaits external spark to ignite movement.
⊢
▦ RSI (21) + EMA9 - (Relative Strength Index – H1):
∴ RSI value: 48.13, EMA9 of RSI: 47.86 - both seated precisely on the neutral axis (50), indicating momentum equilibrium;
∴ RSI has been flatlining between 45/50 for several hours, reflecting a lack of directional force from both bulls and bears;
∴ The minor bullish crossover of RSI over its EMA9 is present, but lacks slope, strength, or historical reliability in the current formation;
✦ Interpretation Layer:
• This is a classic pause zone - RSI not weak enough to signal reversal, not strong enough to suggest advance;
• The close proximity of RSI and its EMA9 suggests a market suspended in technical indecision;
• No bullish or bearish divergence is visible - just momentum silence.
∴ Tactical RSI echoes the broader reading: structure without drive, energy held in restraint.
✴️ Conclusion: Logic sealed - RSI reflects equilibrium; momentum direction is undefined and dormant.
⊢
▦ MACD (9,21) - (Tactical Momentum Engine - H1):
∴ Current MACD Line: (+165.21), Signal Line: (+188.36) - forming a bearish crossover, with the MACD line now trailing the signal line for multiple candles;
∴ The histogram is negative and expanding, confirming that bearish momentum is actively growing, not stalling;
∴ The slope of the MACD line has turned definitively downward, with no flattening in sight - this indicates a sustained momentum bleed;
✦ Tactical Interpretation:
• The momentum crest occurred near $119,700, and since then, MACD has been fading consistently;
• Price has failed to reclaim the MACD highs despite proximity, suggesting a divergence in effort vs. energy;
• This is not a false cross - but a validated tactical downturn with histogram acceleration.
∴ The engine beneath the structure is declining in output - the wheels turn, but they no longer drive.
✴️ Conclusion: Logic sealed - MACD confirms tactical momentum decay; the engine is reversing beneath the surface.
⊢
▦ Stochastic RSI (3,3,21,9) - (Short-Term Momentum Oscillator - H1):
∴ %K: 51.29, %D: 68.32 - a confirmed bearish crossover has occurred, with %K now beneath %D and both values descending;
∴ The oscillator has recently exited the overbought region (>80) and is now transitioning through the mid-zone, reflecting short-term loss of thrust;
∴ Price has failed to respond to prior overbought readings with continuation — indicating momentum dissipation without execution;
✦ Microstructure Insight:
• The current descending arc of %K + %D shows that micro-traders are unwinding positions;
• The zone between 50/70 is a tactical fading region, not a place of strength;
• Absence of a rebound in %K suggests that short-term buyers are standing down.
∴ This oscillator confirms that momentum is not only absent - it is actively declining at the tactical level.
✴️ Conclusion: Logic sealed - short-term momentum cycle is unwinding; compression reigns over velocity.
⊢
▦ OBV + EMA9 - (On-Balance Volume with Tactical Smoothing - H1):
∴ Current OBV: (–89.21K, EMA9 of OBV: –89.02K) - OBV remains slightly below its moving average, indicating a net negative flow of volume;
∴ While price has drifted sideways, OBV has continued to tilt downward, reflecting silent capital outflow beneath surface price stability;
∴ There is no upward curvature or crossover attempt - the OBV line remains submissive, signaling passivity or tactical retreat from market participants;
✦ Strategic Implication:
• The sustained divergence between OBV and price implies that larger hands are not accumulating - rather, they are disengaged;
• This condition often precedes fake breakouts or downward drifts, especially when unconfirmed by volume or RSI;
• The EMA9 serving as a lid rather than support confirms that internal flow is structurally bearish at the H1 frame.
∴ The tactical OBV structure reveals the undercurrent: orderless and hollow, despite price still holding ground.
✴️ Conclusion: Logic sealed - OBV confirms quiet withdrawal of pressure; tactical structure lacks foundational support.
⊢
🜎 Strategic Insight - Technical Oracle:
∴ The H1 tactical frame reveals a market in constrained inertia - price floats between short-term EMA's, yet every major momentum engine (MACD, Stochastic RSI, OBV) confirms internal recession;
∴ EMA's no longer guide - they constrain;
∴ Bollinger Bands contract - but hold no breakout;
∴ Volume is absent - and OBV confirms retreat;
∴ The chart is alive in form, yet dead in force;
∴ No element acts as initiator - only sustainers remain;
∴ The next tactical move must emerge externally, not organically.
✴️ Conclusion: The Tactical Oracle speaks - market energy is sealed beneath compression; movement is possible, but currently unprovoked.
⊢
▦ Structurally (H1):
✴️ Structurally: Neutral.
∴ Price floats near EMA9, below EMA21 and EMA50 - without rejection or breakthrough;
∴ No directional dominance has been established in the current cycle;
∴ Compression prevails over construction - this is not collapse, but pause.
✴️ Conclusion: Logic sealed - the structure is balanced but unsustained; no active trend is in command.
⊢
▦ Tactically: Suspended under Soft Compression:
∴ Momentum indicators (MACD, Stoch RSI, OBV) are all aligned in tactical decay - no upside thrust is evident;
∴ Volume remains below threshold and fails to accompany price fluctuations - a sign of apathy, not conflict;
∴ Price is trapped between EMA's and centered within Bollinger range - with no pressure buildup for breakout.
✴️ Conclusion: Logic sealed - the market is in tactical suspension, drifting within a soft compression chamber; movement requires external ignition.
⊢
⧉
· Cryptorvm Dominvs · MAGISTER ARCANVM · Vox Primordialis ·
⚜️ ⌬ - Wisdom begins in silence. Precision unfolds in strategy - ⌬ ⚜️
⧉
⊢
✠
Ritvs Logicæ in Terræ Chaos;
Nihil Tumultvs. Nihil Vanitatis. Tantum Silentivm, Structvra et Exsecutio.
𓂀 Vbi Volatilitas Disciplinam Tangit - Ibi Sto.
⩘ Porta Solum Aperitur Stantibvs in Silentio.
✠
Ritvs Logicæ in Terræ Chaos;
Nihil Tumultvs. Nihil Vanitatis. Tantum Silentivm, Structvra et Exsecutio.
𓂀 Vbi Volatilitas Disciplinam Tangit - Ibi Sto.
⩘ Porta Solum Aperitur Stantibvs in Silentio.
✠
Related publications
Disclaimer
The information and publications are not meant to be, and do not constitute, financial, investment, trading, or other types of advice or recommendations supplied or endorsed by TradingView. Read more in the Terms of Use.
✠
Ritvs Logicæ in Terræ Chaos;
Nihil Tumultvs. Nihil Vanitatis. Tantum Silentivm, Structvra et Exsecutio.
𓂀 Vbi Volatilitas Disciplinam Tangit - Ibi Sto.
⩘ Porta Solum Aperitur Stantibvs in Silentio.
✠
Ritvs Logicæ in Terræ Chaos;
Nihil Tumultvs. Nihil Vanitatis. Tantum Silentivm, Structvra et Exsecutio.
𓂀 Vbi Volatilitas Disciplinam Tangit - Ibi Sto.
⩘ Porta Solum Aperitur Stantibvs in Silentio.
✠
Related publications
Disclaimer
The information and publications are not meant to be, and do not constitute, financial, investment, trading, or other types of advice or recommendations supplied or endorsed by TradingView. Read more in the Terms of Use.