# 📉 **BTCUSD Market Update & Forecast ( 21st May 2025 )**
**Date:** May 21, 2025
**Analyst:** NextElliott
**Instrument:** BTCUSD
**Current Price:** \$106,376
**Strategy Type:** Elliott Wave, Gann Confluence, Probabilistic Reversal
**Trade Horizon:** 2–7 Days
**Timeframes Observed:** 4H / Daily
---
## 🔍 **Market Context & Price Behavior**
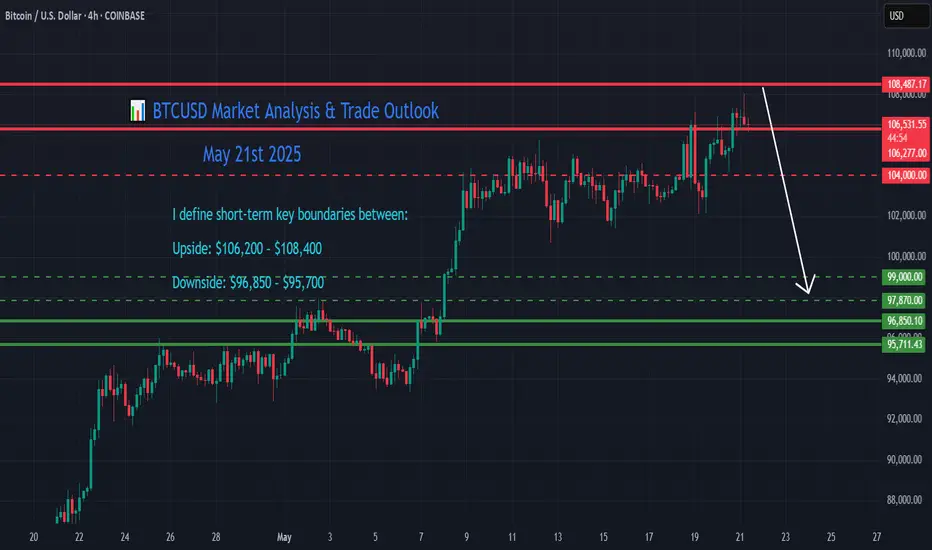
BTCUSD has successfully reached my **upper resistance target zone of \$106,200–\$108,400**, topping out near \$106,400. This zone was previously identified as a **potential exhaustion area**—a Fibonacci cluster and Gann resistance confluence, marking the final stage of a **Wave (3) advance**.

Price is now reacting to this resistance, and early signs of distribution or momentum loss are appearing in the 4H structure. This suggests a high-probability setup for a **corrective pullback** before any potential continuation of the larger trend.
---
## 📐 **Technical Breakdown**
### 🔻 Resistance Confluence Zone (Hit)
* **\$106,200–\$108,400**
* 1.618 extension from prior impulse
* Gann 120°–135° resistance arcs
* Measured wave projection from \$94,500 low
### 🔻 Immediate Support Zones (Pullback Targets)
* **TP1:** \$97,870 – High-volume node + sub-wave 4 base
* **TP2:** \$96,850 – Structure base and Gann 45° angle
* **TP3:** \$95,700 – Final fib/gap support
### 🔄 Elliott Wave Interpretation
* Current price action likely marks the top of **sub-wave 5 of Wave (3)**.
* A corrective **Wave (4)** is anticipated next, typically retracing to the prior Wave 4 of lesser degree:
* **Target range:** \$99,000 → \$97,870 → \$96,850
* Once this retracement completes, a final **Wave (5)** toward new highs may initiate—**provided** structural support holds above \$95,700.
---
## 🧭 **Gann Angle Analysis**
* The recent high aligns with the 120° arc from the March low—commonly a **cycle reversal marker**.
* Gann support lies near:
* **\$97,870** → 45° harmonic
* **\$96,850–\$95,700** → 60°–75° cluster
Timewise, BTC is exiting the minor **May 10–11 Gann window**, entering a possible correction window lasting until **May 24–26**.
---
## 🎯 **Trade Scenario Outlook**
### 🔴 **Bearish Retracement Scenario (Active)**
* **Trigger:** Reaction failure below \$106,200 confirms reversal
* **Targets:**
* TP1: **\$97,870**
* TP2: **\$96,850**
* TP3: **\$95,700**
* **Invalidation:** 4H close above \$108,400
### 🛠️ Risk Management
* Consider short entries on breakdowns below \$104,800 (support break)
* Use stop-losses above \$107,000 (recent high)
* Take partial profits near each retracement target
* Monitor RSI/Volume divergence for early reversal signs near \$97,870
---
## 🧠 **Strategic Commentary**
BTCUSD has met all pre-defined bullish objectives, aligning with the end of a 5-wave advance. The next **logical market move** is a correction to refresh bullish momentum and reset trader positioning. Expect volatility and potential range-based behavior before the next impulsive rally.
This zone offers **ideal conditions for tactical shorts or long re-entries** upon support confirmation.
---
## 📌 **Conclusion**
BTCUSD has tagged its upper resistance zone and now shows signs of topping within a mature wave structure. The anticipated pullback toward **\$97,870** is part of a healthy macro trend and should be monitored for possible long-term re-entry opportunities.
Traders should shift focus to downside targets, apply disciplined risk management, and stay adaptive to emerging price signals.
**Date:** May 21, 2025
**Analyst:** NextElliott
**Instrument:** BTCUSD
**Current Price:** \$106,376
**Strategy Type:** Elliott Wave, Gann Confluence, Probabilistic Reversal
**Trade Horizon:** 2–7 Days
**Timeframes Observed:** 4H / Daily
---
## 🔍 **Market Context & Price Behavior**
BTCUSD has successfully reached my **upper resistance target zone of \$106,200–\$108,400**, topping out near \$106,400. This zone was previously identified as a **potential exhaustion area**—a Fibonacci cluster and Gann resistance confluence, marking the final stage of a **Wave (3) advance**.
Price is now reacting to this resistance, and early signs of distribution or momentum loss are appearing in the 4H structure. This suggests a high-probability setup for a **corrective pullback** before any potential continuation of the larger trend.
---
## 📐 **Technical Breakdown**
### 🔻 Resistance Confluence Zone (Hit)
* **\$106,200–\$108,400**
* 1.618 extension from prior impulse
* Gann 120°–135° resistance arcs
* Measured wave projection from \$94,500 low
### 🔻 Immediate Support Zones (Pullback Targets)
* **TP1:** \$97,870 – High-volume node + sub-wave 4 base
* **TP2:** \$96,850 – Structure base and Gann 45° angle
* **TP3:** \$95,700 – Final fib/gap support
### 🔄 Elliott Wave Interpretation
* Current price action likely marks the top of **sub-wave 5 of Wave (3)**.
* A corrective **Wave (4)** is anticipated next, typically retracing to the prior Wave 4 of lesser degree:
* **Target range:** \$99,000 → \$97,870 → \$96,850
* Once this retracement completes, a final **Wave (5)** toward new highs may initiate—**provided** structural support holds above \$95,700.
---
## 🧭 **Gann Angle Analysis**
* The recent high aligns with the 120° arc from the March low—commonly a **cycle reversal marker**.
* Gann support lies near:
* **\$97,870** → 45° harmonic
* **\$96,850–\$95,700** → 60°–75° cluster
Timewise, BTC is exiting the minor **May 10–11 Gann window**, entering a possible correction window lasting until **May 24–26**.
---
## 🎯 **Trade Scenario Outlook**
### 🔴 **Bearish Retracement Scenario (Active)**
* **Trigger:** Reaction failure below \$106,200 confirms reversal
* **Targets:**
* TP1: **\$97,870**
* TP2: **\$96,850**
* TP3: **\$95,700**
* **Invalidation:** 4H close above \$108,400
### 🛠️ Risk Management
* Consider short entries on breakdowns below \$104,800 (support break)
* Use stop-losses above \$107,000 (recent high)
* Take partial profits near each retracement target
* Monitor RSI/Volume divergence for early reversal signs near \$97,870
---
## 🧠 **Strategic Commentary**
BTCUSD has met all pre-defined bullish objectives, aligning with the end of a 5-wave advance. The next **logical market move** is a correction to refresh bullish momentum and reset trader positioning. Expect volatility and potential range-based behavior before the next impulsive rally.
This zone offers **ideal conditions for tactical shorts or long re-entries** upon support confirmation.
---
## 📌 **Conclusion**
BTCUSD has tagged its upper resistance zone and now shows signs of topping within a mature wave structure. The anticipated pullback toward **\$97,870** is part of a healthy macro trend and should be monitored for possible long-term re-entry opportunities.
Traders should shift focus to downside targets, apply disciplined risk management, and stay adaptive to emerging price signals.
Note
Finally touched $108,400.Disclaimer
The information and publications are not meant to be, and do not constitute, financial, investment, trading, or other types of advice or recommendations supplied or endorsed by TradingView. Read more in the Terms of Use.
Disclaimer
The information and publications are not meant to be, and do not constitute, financial, investment, trading, or other types of advice or recommendations supplied or endorsed by TradingView. Read more in the Terms of Use.