on inverted daily
Note
Closer look at our consolidation on the shorter timeframe. Possible diamond formation here like earlier. Those usually mean continuation of the trend which is down in this situation but opposite direction breakouts happen too its better to wait for it to show usNote
bearish consolidation in progress Note
Tested green EMA in this place on the way up. Should test it here in similar mannerNote
Note
looks ready to fly Note
Note
Should test at least the green EMANote
Daily EMA 100 is tested as expected. Closing dalily above it might suggest test of higher EMA 200 but for now according to the plan it should retrace to the triangle againNote
Ok, EMA 200 was rejected as expected. At least for now. The sharp drop we just had, when I see such formations it always tells me its a possible diamond formation. I'm not sure about the EW count here but it might be something like thisNote
Update for my followers. I circled bitcoin phases on inverted daily chart and the phase we are in now is probably the purple one. Thing to consider when taking long-term tradesNote
Not impossible to get such retrace. Symetrical triangles are hard to guess but main trend still remains bearish on higher time frames. Bears stil control this sideways trend for now. Bulls need to break through 4400 and defend it to start thinking about changing the trend. Until then the plan remains the same which is bearish biased trading as long as weekly and monthly won't show some bullish signs of life or bulls break some important levelsNote
still staying in the sideways scalping zone of boringness. Need to break through red or green to get moving faster. Daily rejection around here might be a good short because that would mean we will most likely test down of the triangle again. It will smash through and squeeze one of the sides
Note
Bulls just broke through resistance which was my long trigger. Target probably around ~5k. EMA 200(another strong resistance is around ~4800)Note
Oh and funny thing. Move starting again with fibbonaci time zone. Such surprise..Note
sry for bad link <deleted>Note
Hmm dont know why its not working Note
our resistance from the past is where this action leads Note
Wow got there really fast and it looks just like a "micro" 3rd wave. Might pullback here and take sideways before going up again Note
I want to see what candle will this monthly be in May. It looks very interesting nowNote
We should build some flag here. My guess Note
Strong bull wave but there is bear div forming already. If it form some good bear candle somewhere in the circle it will surely perform some pullbackNote
It may easy form a triangle here Note
my plan for now. Not sure if triangle will be formed but looking good so farNote
A triple top could be option too for this wave so better watch closely Note
as long as they don't fall down from this channel but here is possible move I smell right nowNote
Note
It has potential for a continuation still but pattern needs time to reveal itself in full gloryNote
Note
Note
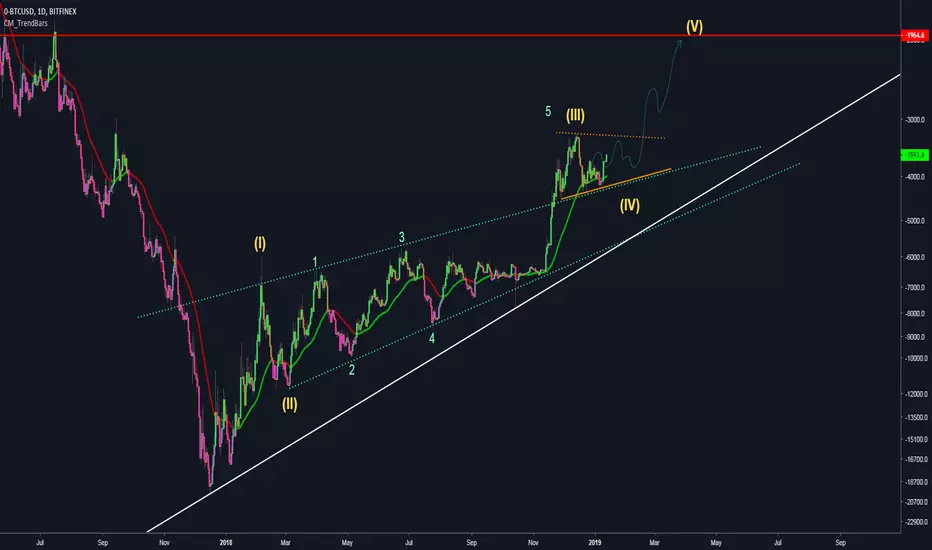
So it wasn't a triangle and It seems we are in this big wedge now. Ending third wave at the momentNote
Short term wave not done yet Note
Obvious wave so it has to fail right. Think some whales had to launch the order 66. Or maybe it was just the time as you can see below we entered another fib time zone. Its very precise lately. Anyway this big elliot is still my play. As long as it won't leave the trendline I will follow. Possible playRelated publications
Disclaimer
The information and publications are not meant to be, and do not constitute, financial, investment, trading, or other types of advice or recommendations supplied or endorsed by TradingView. Read more in the Terms of Use.
Related publications
Disclaimer
The information and publications are not meant to be, and do not constitute, financial, investment, trading, or other types of advice or recommendations supplied or endorsed by TradingView. Read more in the Terms of Use.