Last week I published a chart with an idea that BTCUSD would fall back to the $1500 US range. I received a negative comment about this chart kind of to the point of being a very bad analysis. The commentator lead me to think that maybe I'm being influenced by my own desire to see the coin fall so I can scoop some more up cheap.
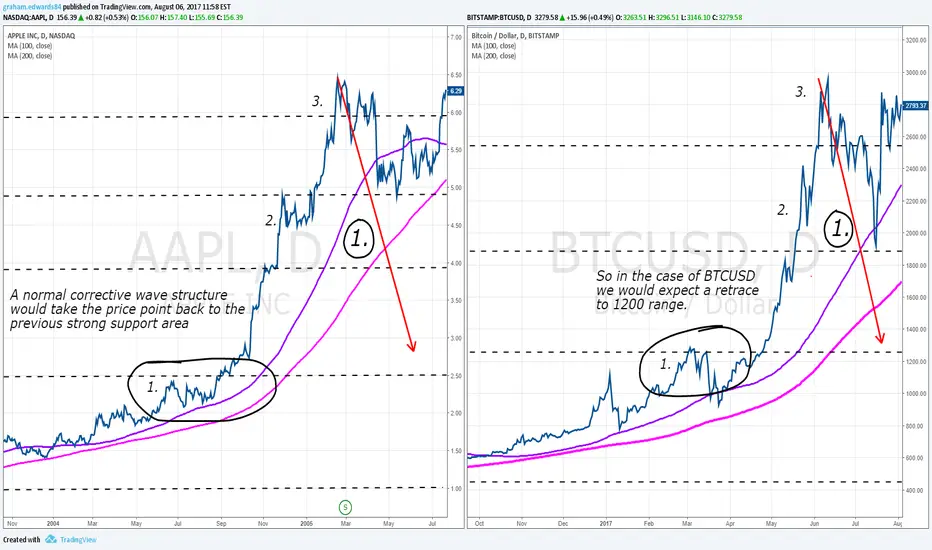
So. I decided to go back in time and conduct a comparison, look at similar wave structures, to another very frothy start up a tech stock many of you know as it was and still is one of the most successful stocks and biggest market caps of all of all time... Apple.
On April 23, 2003 Apple was very beaten down pretty hard having crashed off a $5.00 high dropping to .93 cents, but within a week of hitting that low it started a steady continuous climb much like Bitcoin has just completed, rallying for 21 straight months to $6.00 and only falling to glance the 200 DMA just once in that time period.
I will compare this $6.00 high for Apple stock to bitcoin when it struck a high of US $3000 in June of this year. Now let's take Bitcoin back 21 months to the August - September of 2015 and we can see that it was trading around $200 US. At the time Apple hit $6.00 I'm sure many thought it would undergo a significant corrective wave structure pattern to retrace down to $1.75 range but it didn't... something amazing happened... after a near tag of the 200 DMA it began to rally again going on to double its value to $12.00 in a spectacular spike, one full year later, all the while maintaining a level over the 200 day average.
Having struck 12 bucks in Jan of 2006, Apple did pull back about 40% to the 7 dollar range and all the way to the 400 DMA. But then rallied again spectacularly from $7.00 all the way to $28.00 for a further 18 months all the while staying above the 100 DMA.
Well we all know what happened in 2008, and Apple did suffer a fairly significant crash eventually losing more than half its value. But we also know how that story ended and AAPL stock now sits just shy of $160
Anyway... the point is this ... YES Bitcoin could double in value in the next 12 months to $6000 US and then the following year to $24000 US and it would not be unprecedented, as shown in my AAPL case study. And... if we are rallying higher we could potentially just have completed wave one of a larger three wave structure.
So normally a corrective wave structure would have taken us back down to the strong support of the previous wave high. (This is very common in all chart patterns), but in a bullish impulsive wave structure, instead of retracing to the previous wave high, it forms an impulsive wave to new highs (potentially double) and begins a new larger wave cycle in which the previous high (3000) becomes wave one of the structure.
We should not be afraid of corrective wave structures as these are normal and healthy pull backs that allow more buyers to get excited and move into the market and revitalize momentum and sentiment to begin new rallies. As long as the fundamentals are in place and we still believe in the reasons we invested in the first place then we should look at these pull backs as fantastic buying opportunities.
Disclaimer
The information and publications are not meant to be, and do not constitute, financial, investment, trading, or other types of advice or recommendations supplied or endorsed by TradingView. Read more in the Terms of Use.
Disclaimer
The information and publications are not meant to be, and do not constitute, financial, investment, trading, or other types of advice or recommendations supplied or endorsed by TradingView. Read more in the Terms of Use.