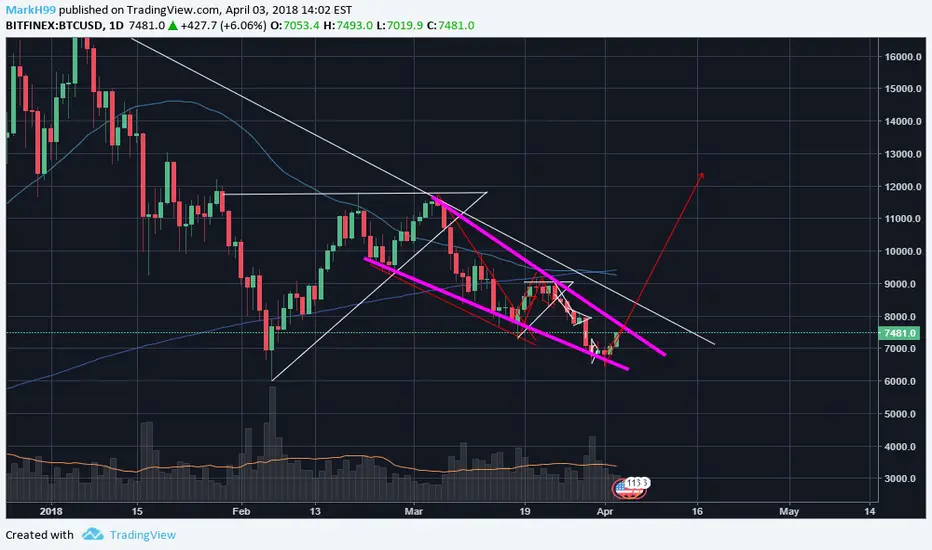
Daily chart shows a big falling wedge pattern which indicates price rise. We need to wait for a break out or see if it bounces of resistance.
See comment for 1h chart...
See comment for 1h chart...
Note
1h chart shows a rising wedge. This one could drive the price back to 7k but it might also let BTC retest 6-6.4k. As always, it can also breakout resistance, which would be a very bullish sign.
Note
Please look at this. Bearish RSI divergence is occuring on the 1h time frame. This indicates something changing in the momentum. Usually it will drive the price down. This togheter with the 1h rising wedge give BTC huge potential to go back to 7k.Note
Ascending triangle with huge potential of breaking down. When it does I will sharpen my stoploss to 6950usd (since I'm short)
Note
Another nice one :)
Disclaimer
The information and publications are not meant to be, and do not constitute, financial, investment, trading, or other types of advice or recommendations supplied or endorsed by TradingView. Read more in the Terms of Use.
Disclaimer
The information and publications are not meant to be, and do not constitute, financial, investment, trading, or other types of advice or recommendations supplied or endorsed by TradingView. Read more in the Terms of Use.