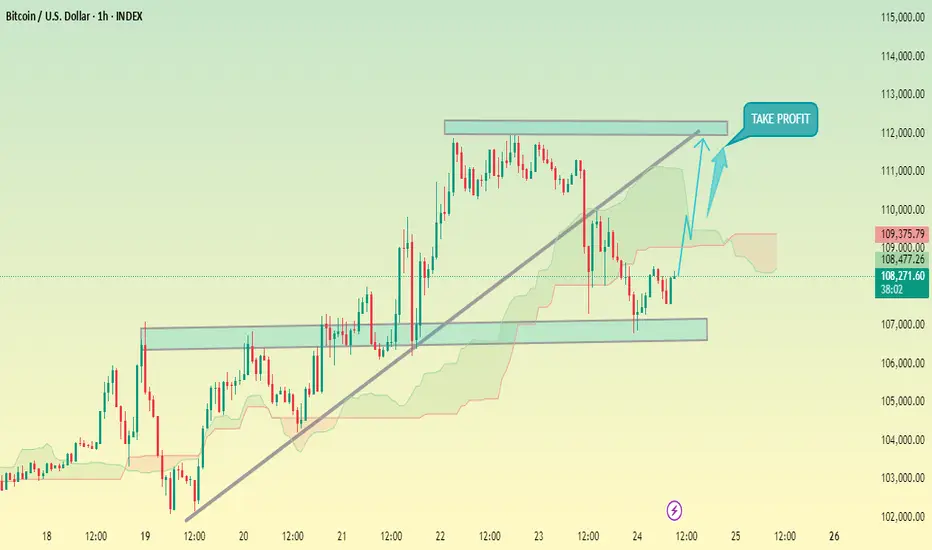
The images you provided are technical analysis charts for Bitcoin, showing potential price movement within certain support and resistance zones. It seems to be a projection of an upward price move, where the "Take Profit" target is around 112,000 USD.
Here are some insights from the charts:
Support zone: Around 107,000 - 108,000 USD.
Resistance zone: Around 111,000 - 112,000 USD.
Ichimoku Cloud: The price appears to be testing the cloud, with a potential breakout to the upside indicated by the projection.
Trendlines: An ascending trendline shows a strong support area.
Would you like a deeper analysis of this chart setup, potential trade ideas, or suggestions for entry/exit points? Let me know how I can assist further!
Trade active
ACTIVE TRADEDisclaimer
The information and publications are not meant to be, and do not constitute, financial, investment, trading, or other types of advice or recommendations supplied or endorsed by TradingView. Read more in the Terms of Use.
Disclaimer
The information and publications are not meant to be, and do not constitute, financial, investment, trading, or other types of advice or recommendations supplied or endorsed by TradingView. Read more in the Terms of Use.
