Log view.
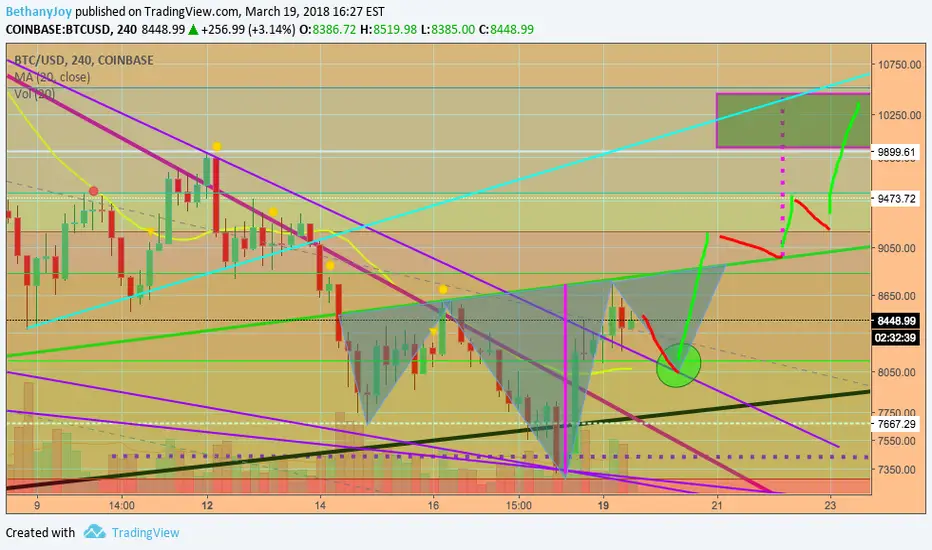
See chart for potential support/resistance levels, anticipated price action and take profit target.
There will be substantial support at the green circle, where the 20MA, the .382 swing fib retrace line and the top of the downtrend line converge.
A bounce here will complete the right shoulder and will be a bullish signal, putting the target in our sight line.
I will update if/when this trade becomes active.
Measure twice, cut once.
May all of life's treasures be yours.
P.S. There are a lot of people looking at my charts but direct feedback is scarce.
I'm still new at this and really appreciate likes, follows, messages and comments.
Thanks!!
Note
That right shoulder was much shallower than I projected, but it's still valid. We just came back down after breaking out to test the convergence of the neckline and the .5 swing fib retrace as support. Convenient! So far so good. Upwards from here is very bullish to one or all of the targets. May consolidate for a while here or on various fibs and previous resistances.Note
8316-9144 is the current bull flag pole and we are consolidating there.full potential upside target of this pattern will be right at the bottom of the IH&S green target price box already on the chart.
Note
Note
bitcoin has been tricky to interpret today. Price fell back below the neckline for a bit but it seems to be supportive now. Waiting for some increased volume and a rally from here.Note
Obviously our flag pattern didn't play out. I took some profit at 9032 last night when price action became wobbly and we started seeing long top wicks on the 15 minute candles. IH&S pattern is not invalidated yet, however it has become far less symmetrical if we are retesting the right shoulder, which makes it less reliable for me.
I am staying in my reduced position until I get clearer indicators. This 8.7k range has been a popular area to consolidate this month. As illustrated by the green box, each consolidation has gotten both tighter in range and shorter in duration. First two consolidations turned up, last turned down. So what does that mean for us? It means we will get our answer soon. 8600 may very well be our short term bottom before rallying to 9.32-9.8 (I'm no longer very optimistic about hitting 10k in this wave) but for now it's wait and see.
Note
Disclaimer
The information and publications are not meant to be, and do not constitute, financial, investment, trading, or other types of advice or recommendations supplied or endorsed by TradingView. Read more in the Terms of Use.
Disclaimer
The information and publications are not meant to be, and do not constitute, financial, investment, trading, or other types of advice or recommendations supplied or endorsed by TradingView. Read more in the Terms of Use.