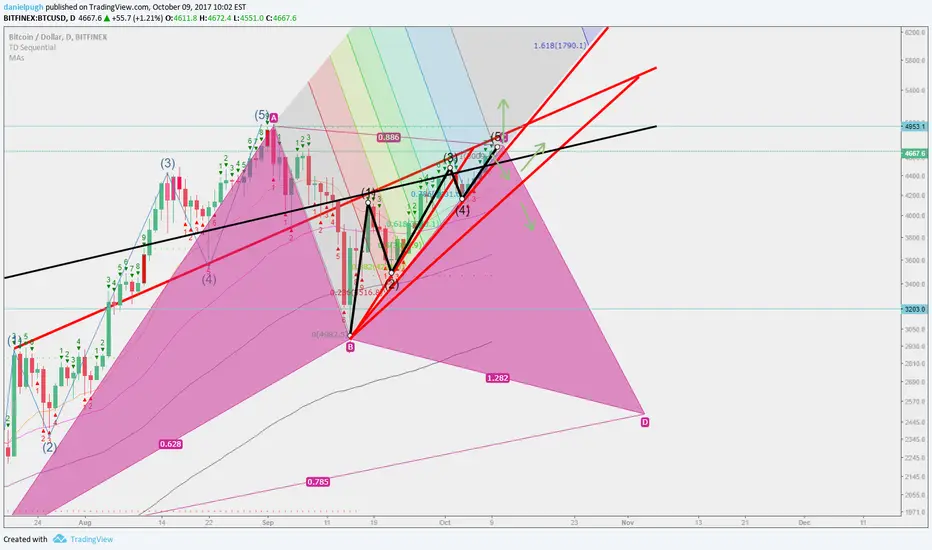
ok so update to last idea
minor correction extended the last triangle (5 mini waves then drop) but found support and redraw of the purple area/triangle.
so no real change apart from higher:
1) push up through old trendline (less likely)
2) small correction/drop through trend to support and continue along the new extended triangle/trendline -
3) drop - which would be neat for my gartley pattern , but apart from wanting this to come true because it would fit nicely
all depends on which primary wave we are in i.e. was the big drop wave 4 (and we are in first part of wave 5) or... 5k was 5th wave and we are still in correction mode
history says we are, but needs confirmation either way. on the bullish side we jumped out of the ichimoku cloud yesterday and TD -0.34% indicator positive.
as always this is not investment advice etc. all points, timescales and patterns bound to be off - much better analysis out there from others!
Note
Ok so option 1, let's see how high and whether it holds/falls after peak. Assuming 5th wave similar to 1st then peak at 5k... Quite likely to correct first then push higher, but we'll find out soonNote
popped out of the triangle last night, but straight back in.RSI v. high
Note
so up it went - niceso based on this chart its got a big fib box (up to 10k intially) between now and the end of next month (roughly). This fits in with the TD weekly count (currently at 2) assuming now shocks/surprises...
Note
Update:
Note
still inside the box but close to the edgesDisclaimer
The information and publications are not meant to be, and do not constitute, financial, investment, trading, or other types of advice or recommendations supplied or endorsed by TradingView. Read more in the Terms of Use.
Disclaimer
The information and publications are not meant to be, and do not constitute, financial, investment, trading, or other types of advice or recommendations supplied or endorsed by TradingView. Read more in the Terms of Use.