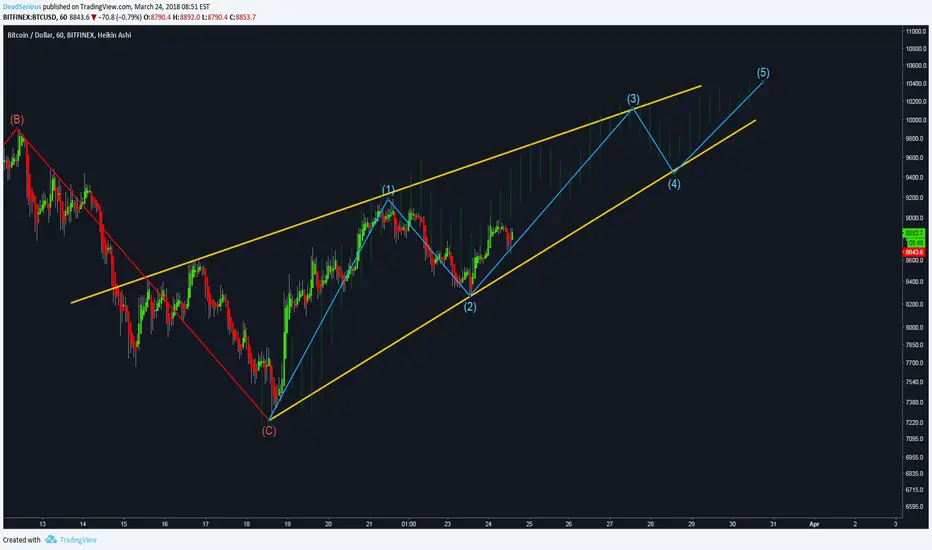
If we are in a bull trend as I believe we are, short term I expect something like that. Lengths of the waves are just experimental. I don't try to predict exact numbers because I can't.
and here is a wider look of this count:

This idea will be confirmed more if we get pass $9000 level. If we fall out through lower yellow trendline it will be invalidated
and here is a wider look of this count:
This idea will be confirmed more if we get pass $9000 level. If we fall out through lower yellow trendline it will be invalidated
Trade active
Breaking up just now. Looking goodNote
We are still in the rising wedge channel I drew but it might fail as retest of 9k level failed again. If we drop below we might need to test 7500 level again. Maybe to make some harmonic patern like this batNote
It might be a fractal of our previous actions in bigger scaleNote
Wedge broke down, idea denied. Second idea is in play nowNote
Also looking at those similar paterns right now. Sneaky placeNote
So bitcoin touched the down trendline of symetrical triangle. Will it hold? It will provide some bounce for now but how strong will it be? Can we do it the third time? Third time's a charm
Here is the view with fractal
Note
After further analyses I will stick to this plan as long as it fitsDisclaimer
The information and publications are not meant to be, and do not constitute, financial, investment, trading, or other types of advice or recommendations supplied or endorsed by TradingView. Read more in the Terms of Use.
Disclaimer
The information and publications are not meant to be, and do not constitute, financial, investment, trading, or other types of advice or recommendations supplied or endorsed by TradingView. Read more in the Terms of Use.