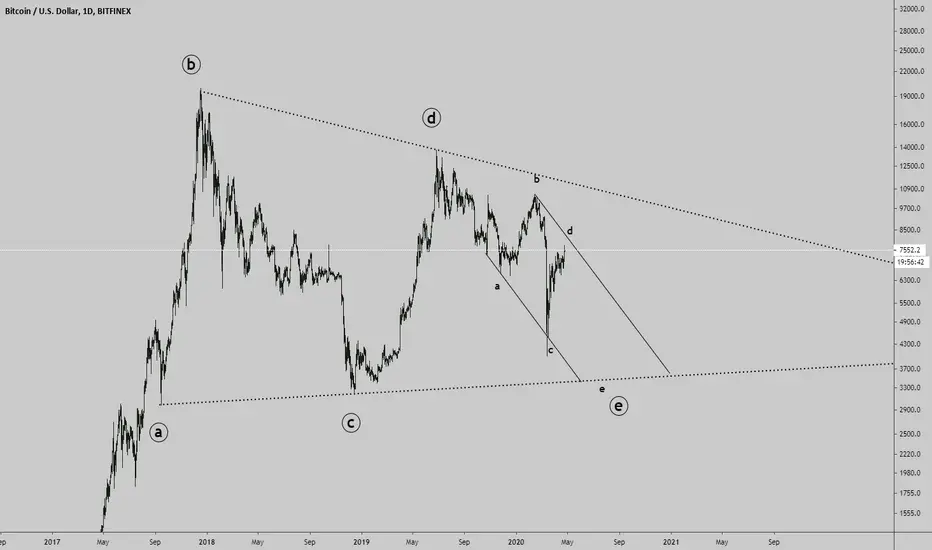
Best chart of all times. Because it's right
This climb might get to 8200-8500 something before e leg
This climb might get to 8200-8500 something before e leg
Note
Dotted trendline is importantNote
We have a pending drop on RSI. One more touch to the bottom curve is missing Note
This is similar behaviour from the past. I noticed bitcoin repeats this pattern on RSI very often with four main curve touches on every cycleNote
Price on daily RSI is overbought. Similar as on the previous big bull run in the past, the correction wasn't big compared to the big move we had but the correction happened and will happen this time too. Pattern RSI is painting right now is pretty much the same. How big the correction be this time is the question. Or bulls gonna go full fireworks due to halving? Time will tellNote
To go full bull btc should back above our previous bull trendline it felt off. It's retesting it right now Note
REgular Bearish Divergence (red) and hidden bearish divergence (blue) spotted. As I predicted above, correction or crash is gonna happen sooner or later. So far price is getting rejected from major resistance from previous bull trendline it felt off in the past (as shown above on monthly chart). With new bear signals it's even worse looking for bulls Note
Also RSI pattern I showed you earlier is still waiting for a fourth touch. This is a scheme price does on RSI regularly Note
Bulls hungry for another retest of 10500. RSI divergence won't dissapear from such move. To cancel it price would have to shoot through 11k like a butter and stay above for some time. Very unlikely imo Note
Cipher harmonic in the making. Also resistance from previous uptrend fallen trendline. Possible drop after finishing pattern Note
My long-term chart Note
Here is my current idea of whats going on. I suspect we are doing first wave of five right now. Not sure where this wave gonna end but it might be close to correction for a wave 2. Note
UpdateThe path looks more clearly now. Seems the correction for the 4th wave may not be too deep.
Disclaimer
The information and publications are not meant to be, and do not constitute, financial, investment, trading, or other types of advice or recommendations supplied or endorsed by TradingView. Read more in the Terms of Use.
Disclaimer
The information and publications are not meant to be, and do not constitute, financial, investment, trading, or other types of advice or recommendations supplied or endorsed by TradingView. Read more in the Terms of Use.